
7 - Predicting future returns
Using a different regression model, can we predict equity market returns over the next 10 years?

Today we’re going to pick back up the expected returns discussion from last week. Next week we’ll talk through the buy vs rent decision when purchasing housing.
To request a topic anonymously, fill out this form.
Key points:
Predicting expected future returns is extremely difficult, and the out of sample predictions for this new model points to this not being possible empirically.
Check out FIRECalc.com, a pretty powerful financial independence calculator (I don’t get paid for saying this, but I just rediscovered FIRECalc this week and was pretty impressed with it).
(Chart of the week) News headlines have become much more emotionally charged since 2000, in a new paper published in October 2022.
Empirically predicting expected future returns
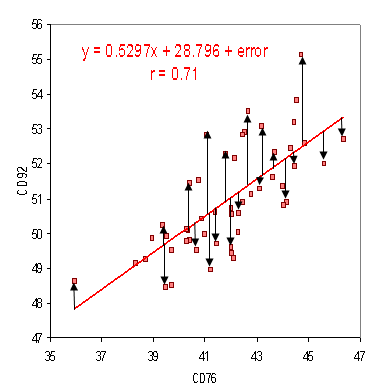
For many, this topic will be a bit in the weeds. Empirical just means that we’re going to use data as opposed to theory to understand a system or phenomenon. Picking up from the last article, we’re going to address some of the issues with our predictions by adjusting the model. Recall that statistical tests determined our sample data is not normally distributed. Our linear regression also produced residuals that were not independent and identically distributed (often shortened to IID). These are both problems that indicate we need a new approach. Instead of using linear regression, we’re going to try quantile regression. This method relaxes some of the requirements of linear regression and is used widely in econometrics, which is the branch of economics that focuses on describing the economy using mathematical models. Quantile regression returns results in what is essentially a distribution of possible outcomes. I spent a lot of time playing around with different techniques1 and the final model that I came up with only uses five independent variables. Here are the results of the fit on our data.

Quantile regression fits to a specific percentile of the dependent variable (the response in this case is the future 10 year annualized return on the S&P 500), allowing us to build confidence bands around our prediction. The above time series must stop in 2013 because we don’t have a full 10 years worth of data to determine what that expected future return would be. But what would this model say about the current environment? Well, here are the results for data since 2016.
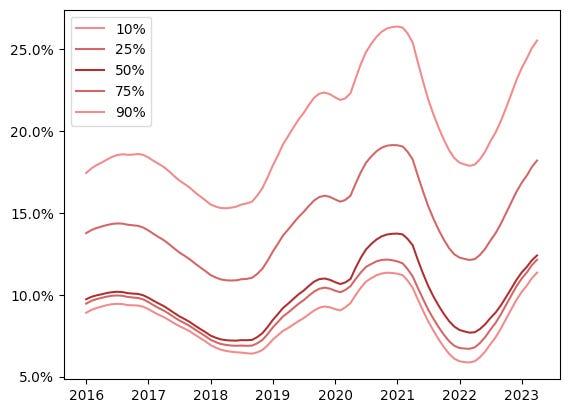
These are smoothed probabilities, and I think the results are rather interesting. Let’s consider the 10th percentile line. This line is the predicted return level at the 10th percentile (a 90% chance that returns will be higher than where the line is at). The 50% line indicates the median prediction. You can see a small blip caused by the pandemic in early 2020, but interestingly, the 10th percentile of expected returns being so close to the median (50th percentile) indicates the model is confident returns will not be much lower than the median. On the upside, the model is uncertain of how high returns might be. Based on an out of sample test though, this should be taken with a pretty big grain of salt.
Out of sample test
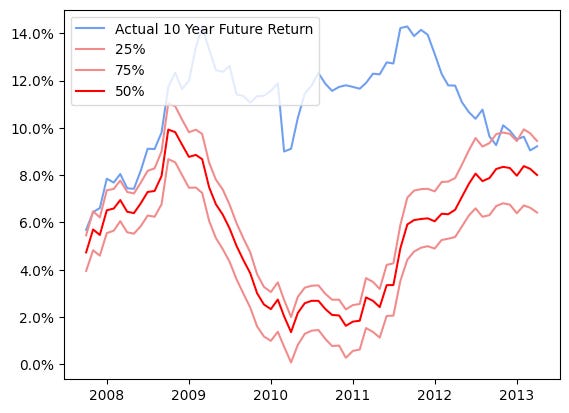
What I did above is fit the model to some training data and then test how that model performs on data the model hasn’t seen before. This will tell us how likely it is that our predictions will come true. Here are the results of the model when we only train it up to 2008 and then show it data from 2008 onward. The red prediction lines don’t track the blue line that represents what actually happened indicating the model performs poorly in new situations. The important takeaway from this exercise is that while the CAPE ratio has some predictive power most of the time, it’s very difficult to predict what the returns will be over the next 10 years with any accuracy. Imagine you are trying to predict returns in March of 2013. Well, 10 years later you would be dealing with the market selloff caused by COVID. It would have been nearly impossible in 2013 to predict that the stock market would sell off because of a pandemic that swept the globe.
FIRECalc
FIRE stands for “financial independence, retire early”. It’s the idea that you should reduce your standard of living when you are young and save as much money as possible so that you will achieve financial independence earlier than 65 years old. FIRECalc helps to answer the question of when you achieve that financial independence by taking in some inputs like the current value of your stock portfolio, the date you plan to retire, how long you plan to be in retirement for before you pass away, and how much money you will invest until you retire, and it tells you what percentage of the time you would have run out of money based on previous economic cycles. In my opinion, the benefit of not being forced to work to pay rent after achieving financial independence means you won’t be trapped in a job you don’t like, and you’ll be able to make decisions that will maximize your net worth over the long run. I would highly recommend playing around with this tool to get a better sense of your saving and investing strategy.
Chart of the week
This is a pretty fascinating chart that made the rounds after this peer reviewed study was published in October.

The title is self explanatory, but I think the broader point here is that the more news content people consume, the more emotionally volatile they are likely to feel. To me, one of the contributing issues is that people feel like they know more about the world the more news they read, which isn't always true. Over the last year, I’ve blocked Google News and other news feed aggregators and have switched to just paid news. I’ve noticed that facts make up much more of the stories I consume, and looking back I’m glad I made the switch.
I attempted to scale the data, and use PCA to remove multicollinearity. I also adjusted many of the independent variables that I was using.