
17 - Comparables
The last, simplest way to compare companies

Key points:
Valuation multiples are an easy way to compare investments based on what investors value a public company at.
There are many valuation multiples, and they each tell you something slightly different about the business. One ratio looks at earnings while another looks at book value of equity1, so it’s a pretty flexible method of analysis depending on the business metrics that you care about.
To request a topic anonymously, fill out this form. To reach me with questions, please email alexwarfel@gmail.com. You can also reply to this email directly.
The last way we’ll talk about valuing a company is using comps. This method is great because it allows you to figure out what any business is worth, public or private, based on what the public markets are valuing different business metrics at. Analysts often use this when trying to value a company that is about to go public. The further away that a company is from going public, the less accurate these comparables can be because the quality of earnings, for example, is much lower because it’s hard to know how comparable the businesses actually are if one of them isn’t telling you details about the business.
To actually do this, we first identify comparable companies and then see what the comparable multiples are. By multiples, we mean, what is the price of the company relative to revenue? How about free cash flow? How about book value of assets? Once we know what those multiples are, we can apply them to other companies to see if they’re trading oddly. One great way to do this is through the website FinViz.
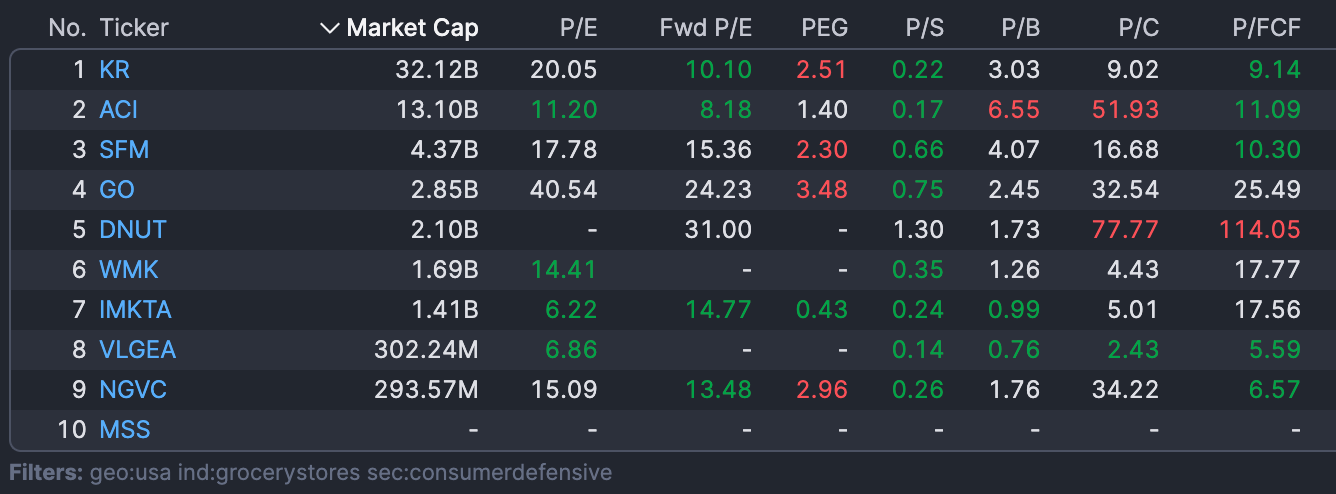
Here’s a screenshot above of publicly traded “grocery stores” in the US. Before diving in, I’ll orient you to what you’re looking at. First, we have sorted these stocks by market cap, which is what the market has valued the business at. This math is pretty straightforward, if one share is worth $100, and there are 320 million shares, then the company is worth $32 billion dollars. Next we have P/E, which is the market cap divided by net income, Fwd P/E is the price over consensus analyst estimates of future earnings, PEG is the Fwd P/E ratio divided by consensus growth rate estimates for their earnings, P/S is price to sales (revenue), P/B is the price over the book value of assets, and P/C is price over cash, and P/FCF is price over free cash flow. You can also think of these things as rates. For example, for KR, for ever dollar earnings, that’s worth $20.05 in market capitalization.
Sometimes it’s hard to find comps because there aren’t always great comparisons, for example DNUT is on here, but is Krispy Kreme a grocery store? Probably not in the same way Kroger is. So you have to make some decisions about what exactly to compare. Kroger (KR), Alberstons (ACI), and WNK (Weis Markets) all operate grocery chains so they seem to be a good place to start.
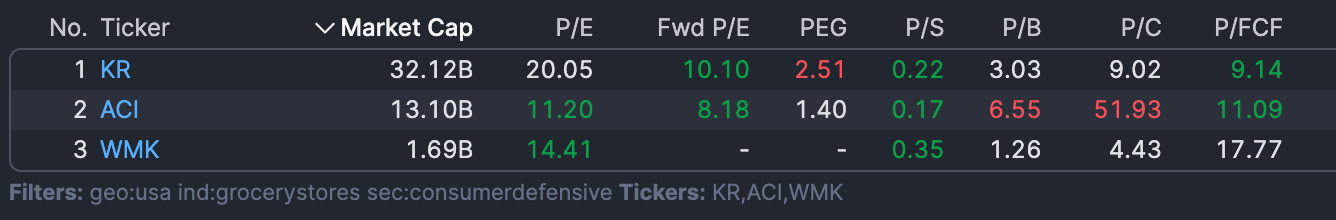
Since price is in the numerator of all of these, this means that the higher the number means investors are paying more per dollar of earnings, sales, book value, etc. Let’s say you were trying to value another grocery store that has the following financial performance. First you could average the multiples for these three stores like so:

And then you would apply those multiples to whatever the amounts were for this new company.

This is a crude way of thinking about it, and you can be far more technical than this. But this is generally how to think about what a stock is worth. So remember this the next time you want to invest because you think the stock price is low, or because you think the company is about to release a great new product. A bunch of wall street analysts are crunching the numbers much more deeply than I have done above, but this will give you a frame of reference for how to figure out if a business is worth the cost.
This is powerful because you can start to compare other investments. For example, if you’re considering purchasing a rental property, the return on those are often expressed as cap rates2. If you divide 1 over the cap rate, you’ll convert the cap rate to a PE multiple, which can then be compared to the stock market. Then, you can find an apartment REIT3 and compare those PE ratios. If the apartment that you’re considering purchasing as a PE ratio lower than the REIT, that means you’re essentially getting earnings for less money. Remember, a PE of 20 essentially means you’re payihng $20 for $1 of earnings. If an apartment yields 6.67%, that’s a PE ratio of 15, which is the same as saying $1 costs $15. If the investments were equal, then it makes more sense to go with the 15 PE. Of course, the PE could be lower because the quality of those earnings could be lower.
Support
If you’ve enjoyed this article and you’d like to support me, please consider checking out some of the spreadsheets that I’ve built to make your financial planning easy. Thank you!
For value investors, book value is the sum of the amounts of all the line items in the shareholders' equity section on a company's balance sheet. You can also calculate book value by subtracting a business's total liabilities from its total assets.
Calculated by dividing a property’s net operating income by its asset value, the cap rate is an assessment of the yield of a property over one year. For example, a property worth $14 million generating $600,000 of NOI would have a cap rate of 4.3%. That means that you can expect a roughly 4.3% annual operating cash flow given the price paid for the property.
A real estate investment trust (REIT) is a company that owns, operates, or finances income-generating real estate. Modeled after mutual funds, REITs pool the capital of numerous investors. This makes it possible for individual investors to earn dividends from real estate investments—without having to buy, manage, or finance any properties themselves.