
What the Market Isn’t Telling You
Returns are average, white-collar hiring is stalling, and investors are misreading both risk and performance. Here’s what actually matters.

Programming note: I plan to start sending these out on Thursdays going forward as I test out when the best date is!
Key Takeaways
In the news - Hiring for white-collar roles like HR, IT, and engineering has dropped over 25% since 2018, signaling a structural slowdown in professional job markets.
Chart of the week - The current 3-year inflation-adjusted return of the S&P 500 is at the 53rd percentile—right around its long-term average—suggesting markets are not historically overextended.
Beyond Bias: Ambiguity Aversion - Ambiguity aversion leads investors to avoid unfamiliar opportunities, but using strategies like barbell portfolios can help mitigate this bias and improve returns.
Building Wealth: Choice Architecture for Yourself - Simple environmental tweaks—like reminders, visual cues, or added friction—can make wealth-building behaviors easier and more consistent.
Historical Perspective: The Nifty Fifty - Even dominant companies can be bad investments if overvalued—reminding investors to consider price, not just quality, when buying into megatrends like AI.
Literature review: The Hot Hand in Jeopardy - New research shows that people overreact to winning streaks in unrelated areas—just like investors do—highlighting the danger of chasing recent performance.
Have a question?
I’m adding something new this week—reader Q&A. If you have a question about the economy, investing, financial decision-making, or historical finance, submit it anonymously using the form below. Each week, I’ll pick one question and provide a detailed response in the next newsletter.
This isn’t financial advice, but I’ll break down ideas, provide deeper research, and share insights on topics you’re curious about. If you accidentally include personal details, I’ll remove them and keep the discussion hypothetical.
No question is too big or too small—if you’re wondering about something, chances are others are too. Submit your question here, and I’ll tackle it in the next edition!
In the news
Despite the headline-grabbing low unemployment rate, white-collar hiring — particularly in tech — has slowed dramatically. New data from LinkedIn points to a clear white-collar recession, with sharp declines in recruitment for roles in IT, HR, and engineering. While some of the discourse around a ‘white-collar recession’ may be overstated, the numbers are worth paying attention to as we try to understand what this shift really means for professional workers.
By the numbers:
Hiring in human resources is down 28% since 2018.
Marketing roles have declined 23%.
IT hiring is down 27%, quality assurance by 32%, and product management by 23%.
Even engineering — once considered recession-proof — is down 26%.
Project and program management hiring has dropped 25%.
In contrast, healthcare jobs are up 10%, and roles in community and social services are down only 3%.
Job postings for physicians and physical therapists have surged 80%+, while postings for software developers and data roles are down 20%+.
What’s driving the downturn:
Over-hiring during the pandemic: After massive recruitment spikes post-2020, many tech companies now face bloated headcounts and are relying on hiring freezes and attrition to rebalance.
Reduced voluntary turnover: Fewer employees are leaving their roles, with voluntary attrition falling from 27% in 2022 to under 20% in 2025, reducing the need for backfills.
AI-led productivity gains: Companies are leaning on tools like ChatGPT and AI coding assistants to complete tasks faster, lowering the demand for additional hires. Google reports 25% of new code is now AI-generated.
Hiring paralysis: With more qualified candidates flooding the market, decision-making has slowed. Time-to-hire has increased from 52 days in 2021 to 66 days in early 2025.
Why it matters:
This is a structural shift, not just a temporary slowdown. Job seekers face intense competition, slower feedback loops, and a market saturated with applicants. While tech roles are beginning to rebound — new postings rose from 144,000 to 223,000 since last year — hiring remains far below pre-pandemic levels.
The bottom line:
White-collar professionals, particularly in tech, face a drastically more competitive landscape. As hiring managers get overwhelmed by applicant volume and lean on AI to boost productivity, fewer roles are opening — and they’re harder to land.
Chart of the week
This chart shows the distribution of 3-year, inflation-adjusted annualized returns for the S&P 500, calculated monthly from March 1995 through March 2025. By using rolling 3-year windows and adjusting for inflation, the analysis focuses on real purchasing power — not just nominal gains. That’s a critical distinction when assessing whether the market is “overextended” or “undervalued” in a historical sense. Investors don’t spend nominal returns; they spend real ones. So to understand whether today’s market outcomes are strong, weak, or typical, it makes sense to anchor that judgment in after-inflation results. The data shows current real returns at the 53rd percentile — slightly above the long-term median — suggesting markets are neither frothy nor cheap by historical standards.
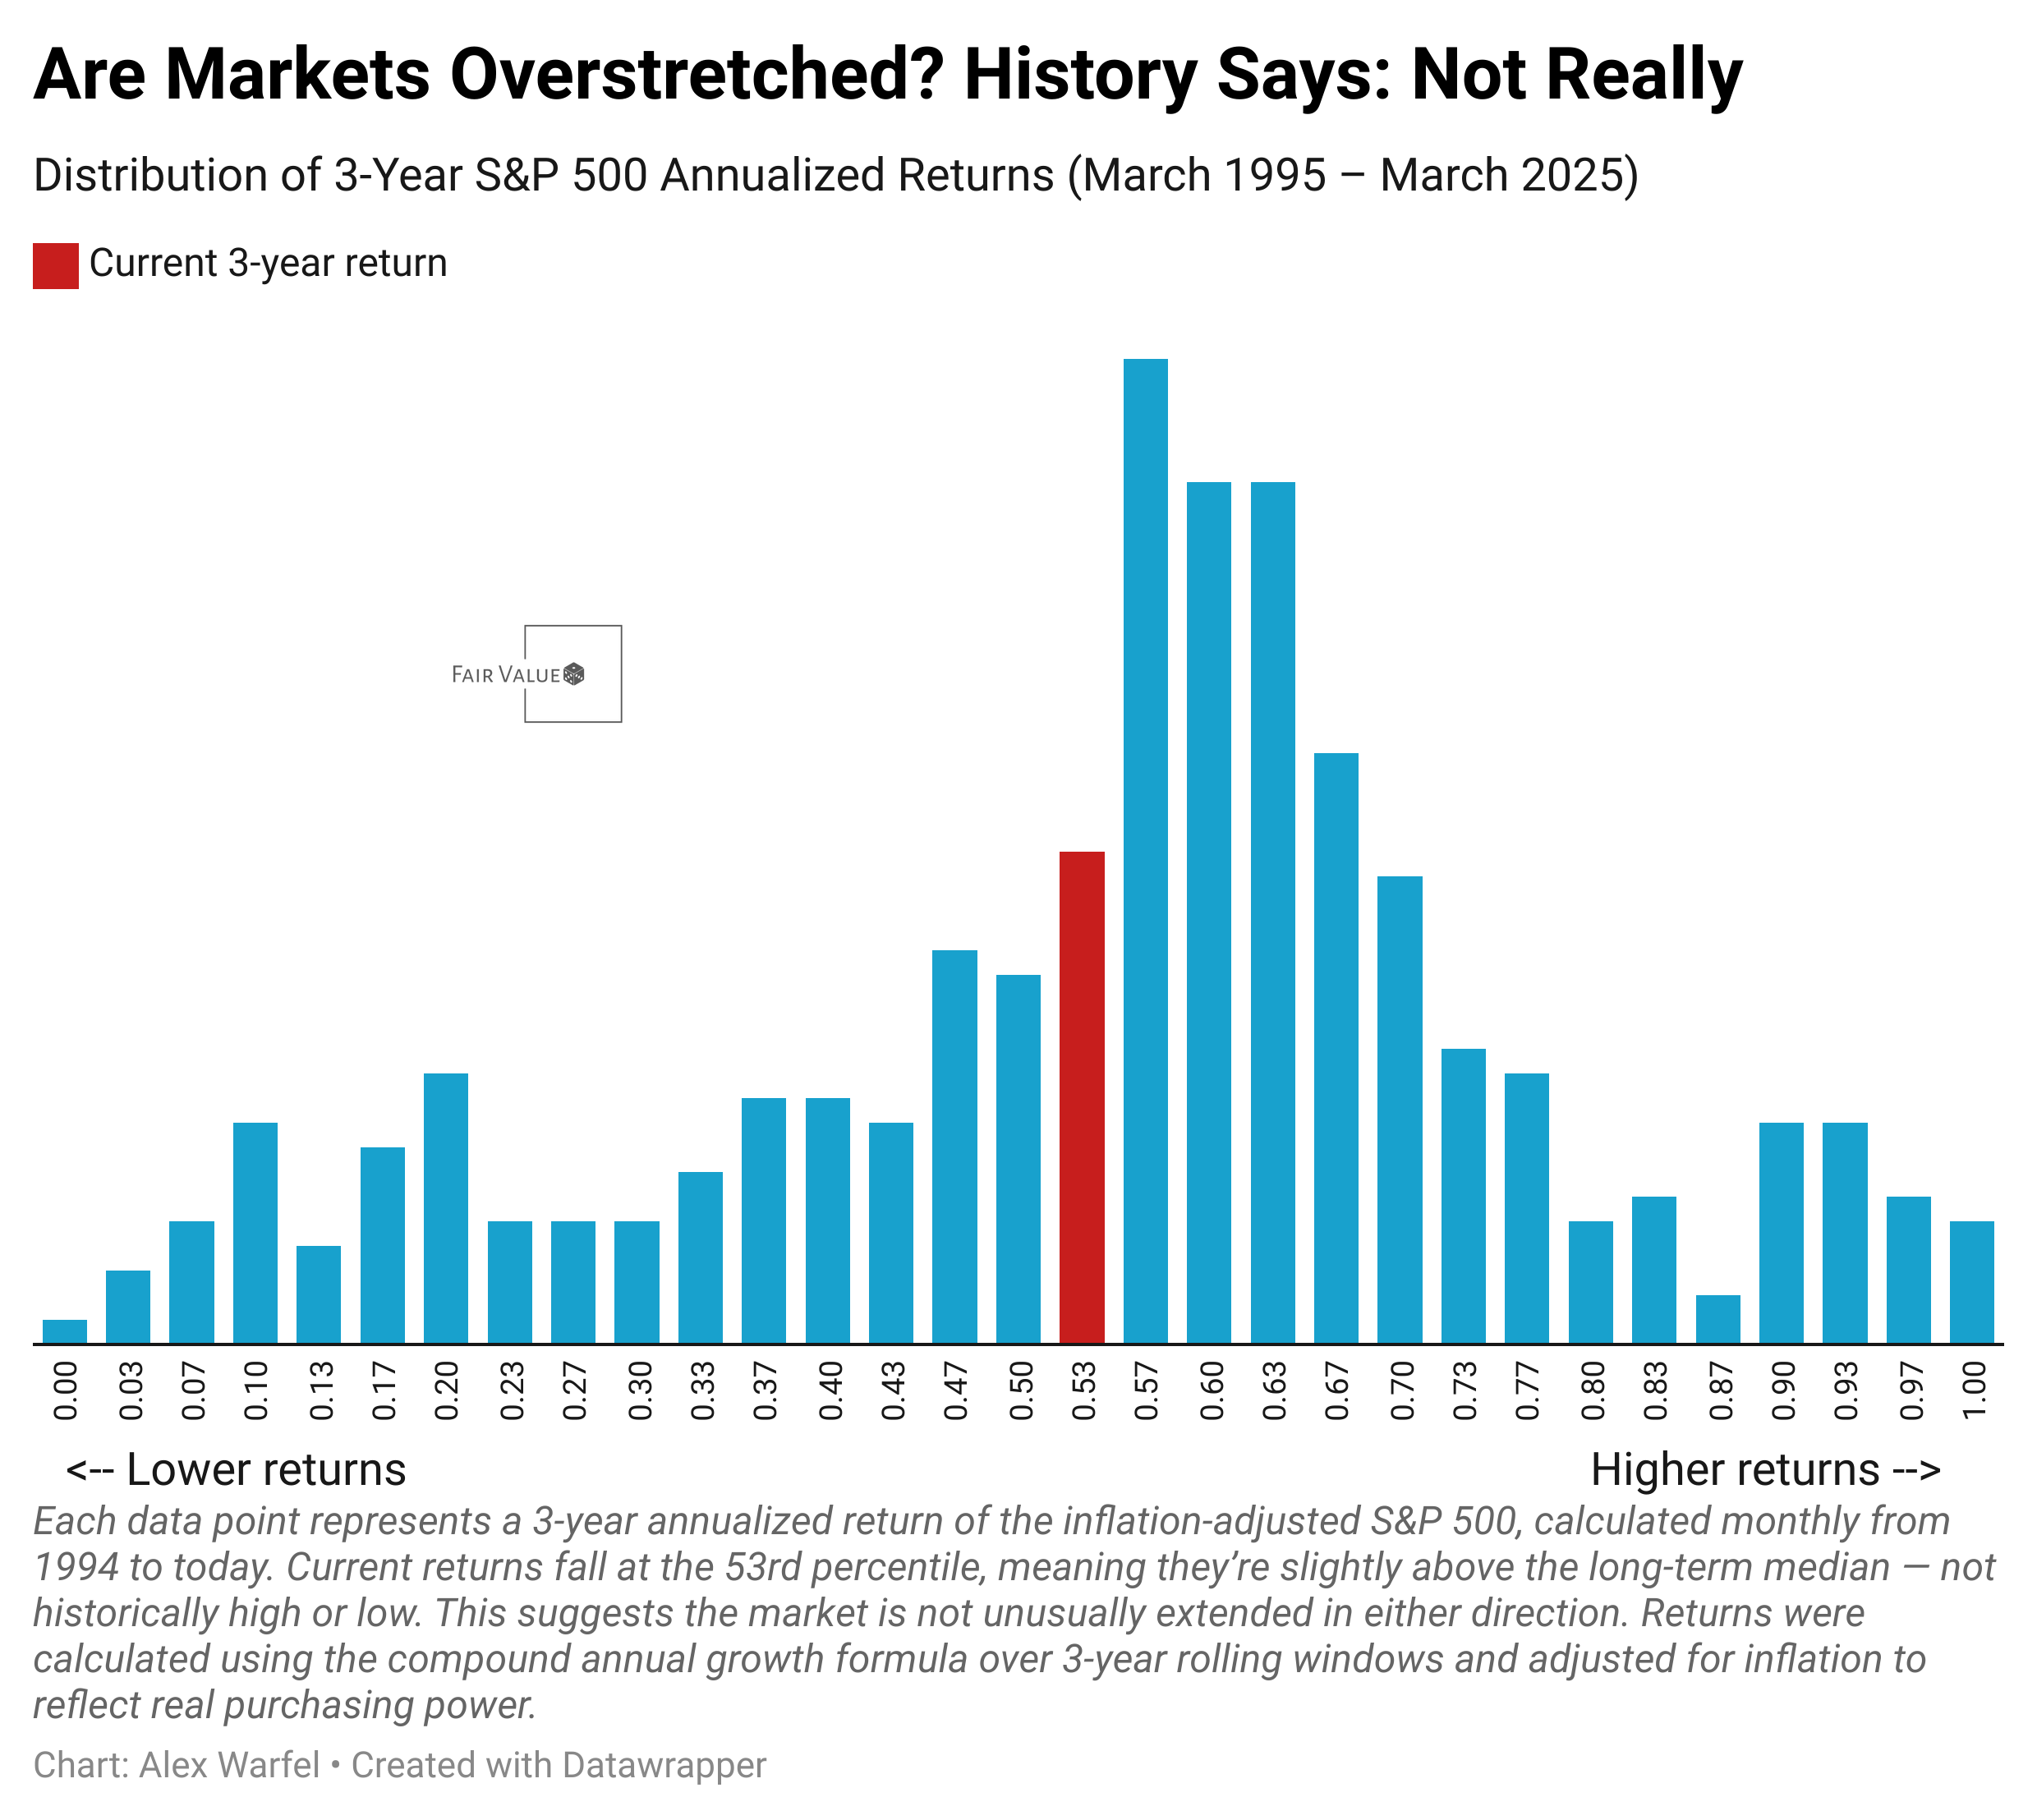
This kind of distribution analysis matters because it adds historical grounding to conversations that are often driven by emotion or recency bias. When markets have recently surged or slumped, it’s tempting to assume we’re at an extreme — but long-term data often tells a more measured story. Seeing where current inflation-adjusted returns fall within a 30-year range helps cut through short-term hype and pessimism. It also reminds investors that markets go through natural cycles, and that mid-range real returns — like the 5.5% annualized figure we’re seeing now — are historically common. That’s useful for setting expectations, tuning portfolio risk, or simply keeping perspective.
Beyond Bias: Ambiguity Aversion — Why We Shy Away from the Unknown (Even When It Might Pay Off)
Imagine you’re offered two investment choices: one is a well-known U.S. company with decades of financial data, analyst coverage, and predictable earnings. The other is a promising biotech firm operating in a new therapeutic space, with limited history and more uncertainty about future outcomes. Even if the second option has a higher expected return, most investors will still pick the first. That’s ambiguity aversion at work. It’s not just a fear of risk—it’s a preference for known risks over unknown ones. In practice, this leads many investors to underweight emerging markets, early-stage companies, or innovative sectors like AI, clean energy, or biotech—not because they’ve done the math, but because those areas “feel” uncertain. And that discomfort nudges portfolios toward familiar names, even when those names may be fully priced or offer limited upside.
To protect yourself from ambiguity aversion, it helps to reframe how you think about uncertainty. One useful tool is the barbell approach—allocate a large portion of your portfolio to stable, well-understood assets, but reserve a small slice (say, 5–10%) for more speculative, high-upside opportunities. This lets you participate in innovation without betting the farm. Another technique: ask yourself, “If this company or market were more widely understood, would the price already reflect that?” Often, unfamiliarity is exactly why the opportunity exists. You can also lean on structured processes, like setting an investment checklist that includes room for conviction-building research—not just headlines. When you recognize that ambiguity aversion isn’t a rational assessment of risk but an emotional discomfort with the unknown, you can start using it to your advantage—by looking where others aren’t.
Building Wealth: Choice Architecture for Yourself
One of the most effective but underused tools for building wealth is designing your day-to-day setup to make smart financial decisions the easiest ones to make. This concept—borrowed from behavioral economics—is called choice architecture, and it’s about shaping your surroundings so that good decisions require less willpower. For example, if you’re trying to invest more consistently, consider placing a post-it on your laptop that says “Have I invested this month?” or setting a recurring calendar event every payday titled “Review portfolio.” These nudges might sound simple, but they reduce the cognitive burden of remembering to act, making it more likely you’ll follow through. Studies like Thaler and Sunstein’s Nudge (2008) show that even small shifts in how choices are presented can meaningfully influence behavior—without removing freedom or requiring discipline.
To implement this, think about where friction is stopping you. If you forget to track expenses, keep a notebook or budgeting app pinned to your phone’s home screen. If you check your brokerage account too often and get tempted to trade, bury the app in a folder or log out after each use—subtly increasing the effort required to act impulsively. You can also use visual cues to reinforce long-term goals: keep a simple progress tracker where you’ll see it often, or store a one-page investing checklist in your wallet or desk drawer. These physical and digital tweaks serve as constant, low-effort reminders that anchor your attention to the behaviors that actually move the needle. Research from Keller, Harlé, and Vlaev (2021) found that well-designed nudges can significantly improve financial behaviors—even in experienced populations. The key is to reduce reliance on memory and motivation, and instead make better choices the default, visible, and easy.
Add to your toolbelt
Take control of your financial future with Rainier FM—your AI-powered financial planning companion. FM stands for Financial Model, and that’s exactly what this app delivers: optimized, data-driven financial plans tailored to your goals. Using advanced optimization techniques and AI-driven insights, Rainier FM helps users navigate everything from retirement planning to wealth building with confidence. Pricing reflects the cost of running the service, but I’m actively gathering feedback to refine and improve it. Here’s an example of an insight this app can help you uncover.

If this sounds like something you’d find valuable, feel free to reach out or sign up—I’d love to hear what you think as I continue developing the platform!
Historical Perspective: The Nifty Fifty—When “Too Good to Fail” Wasn’t Good Enough
In the late 1960s and early 1970s, investors fell in love with a group of high-growth, blue-chip companies known as the “Nifty Fifty.” These stocks—names like Xerox, Polaroid, IBM, Coca-Cola, McDonald’s, and Johnson & Johnson—were seen as unbeatable, industry-dominating firms that could be bought and held forever. The belief was that their growth was so reliable and their market positions so secure that price didn’t matter. As a result, valuations soared. Some traded at price-to-earnings (P/E) ratios above 50—astronomical by historical standards. This era birthed the concept of “one-decision” stocks: the only decision investors needed to make was to buy.
But like all narratives that ignore valuation, this one didn’t end well. The 1973–74 bear market—driven by inflation, a recession, and rising interest rates—crushed even the highest-quality companies. Xerox lost over 70% from its peak. Polaroid fell nearly 90%. Many of these once-invincible stocks took more than a decade to recover, and some never returned to their prior glory. Investors who had dismissed valuation as irrelevant were reminded that even the best companies can be bad investments if bought at the wrong price (Siegel, 1998).
Fast forward to today, and echoes of the Nifty Fifty can be heard in the rise of today’s AI giants. Nvidia’s valuation has expanded dramatically, and other megacap names like Microsoft, Amazon, and Google are central to both AI infrastructure and investor enthusiasm. While these companies may be more profitable and better capitalized than their 1970s counterparts, the psychology is familiar: investors crowding into dominant firms with world-changing narratives, often without regard to how much of that future is already priced in. Just as Polaroid was once thought to own the future of imaging, many now believe Nvidia owns the future of computation.
The Nifty Fifty story isn’t a warning against innovation or large-cap growth—it’s a reminder that great companies and great investments aren’t always the same thing. When investor excitement runs ahead of fundamentals, it can take years for valuations to come back to earth. This doesn’t mean today’s AI leaders are doomed to crash—but it does mean that disciplined investors should remain sensitive to valuation, concentration risk, and the tendency to overpay for certainty. As history shows, even the most beloved stocks can lose their luster.
Supporting Research
Siegel, Jeremy J. Stocks for the Long Run. McGraw-Hill, 1998.
Malkiel, Burton G. A Random Walk Down Wall Street. W.W. Norton, 2003.
Fama, Eugene F. “Efficient Capital Markets: A Review of Theory and Empirical Work.” Journal of Finance, vol. 25, no. 2, 1970.
De Long, J. Bradford, and Andrei Shleifer. “The Stock Market Bubble of 1929: Evidence from Closed-End Funds.” Journal of Economic History, vol. 51, no. 3, 1991.
Literature review: The Hot Hand in Jeopardy — and What It Reveals About How We Judge Performance
Rational and Irrational Belief in the Hot Hand: Evidence from Jeopardy! (Kukavica & Narayanan, 2024)
A new study by Kukavica and Narayanan (2024) uses Jeopardy! — the classic trivia game show — to investigate a surprisingly persistent bias in human judgment: the hot hand fallacy. In theory, players should answer questions based on knowledge, not streaks. But the researchers show that both contestants and viewers consistently behave as if winning answers come in clusters — as if someone “on a roll” is more likely to keep answering correctly, even when each question is independent. Using data from over 9,000 Jeopardy! episodes, the study analyzes real-time decisions contestants make when choosing which player to challenge with a buzzer and which dollar amounts to wager. The results reveal a mix of rational updating and irrational bias — and offer important lessons for how investors interpret streaks in performance.
In one striking finding, Jeopardy! players consistently avoided buzzing against opponents who had just answered a string of questions correctly. This behavior could be rational if it simply reflected updating beliefs — for example, believing a contestant who answered three history questions correctly might be stronger at that category. But the study finds that players treated streaks as signals of generalized ability, even when the questions spanned unrelated topics. Contestants who were “hot” saw opponents back off across the board, even when knowledge areas shifted. This is classic hot hand bias — the mistaken belief that past success increases the likelihood of future success, even in random or unrelated domains.
Interestingly, not all hot hand beliefs in the study were irrational. The researchers find that some contestant behaviors did reflect Bayesian updating — where it actually makes sense to infer skill from past performance. When streaks occurred within narrow knowledge domains (e.g., three science questions in a row), other players’ deference was more justified. But even in these cases, players overreacted, giving too much weight to short streaks. In technical terms, contestants showed both rational learning and over-extrapolation — a pattern that mirrors how investors often chase performance. Funds with recent outperformance draw inflows (Frazzini & Lamont, 2008), even when future returns don’t follow. Just as Jeopardy! players overweight recent wins, investors tend to believe that streaks signal enduring skill — even in volatile or mean-reverting markets.
So what does this mean for investors? The takeaway is clear: don’t confuse luck for skill. When evaluating a stock picker, fund, or strategy, a hot hand might not indicate true talent — especially if the wins come in diverse or uncorrelated areas. Look for repeatability within a domain, not across domains. And be wary of performance-chasing behavior, whether in your own decision-making or among your clients. As the authors note, the best decision-makers learn to distinguish when a streak signals genuine expertise and when it’s just statistical noise. Like Jeopardy! players choosing who to challenge, investors are constantly updating their models of competence. But doing so accurately requires more than just counting wins — it requires understanding context, correlation, and the limits of intuition.