
[Pro] 15 - Dividend discount models
Expanding on the dividend discount model

I assume that you have read the free version already, so lets talk a bit more about dividend discount models. First we’ll address some issues. To start with, the dividend discount model assumes a constant dividend growth rate, which we should expect to be extremely unlikely. Another issue is that the dividend discount model praises dividends over capital appreciation. From 1926 through September of 2023, dividends have contributed about 32% of the total return for the S&P 500, while capital appreciation contributed the other 68%.
You’ll often see charts like below, but what this chart is missing is a line that shows just the growth of reinvested dividends without the capital appreciation component. If you remove a source of return over a long enough time period the differences will look extreme due to compounding.
Growth of $10,000 (1960–2022)

This means that the dividend discount model, in some sense, misses one of the biggest sources of returns for stocks. However, it’s worth noting that the amount that dividends contributed to the value of stocks varied significantly by the decade.
S&P 500 Index Annualized Total Return by Decade (%)

The other issue with focusing on dividends is that it doesn’t address taxes. Dividends are typically not as tax efficient as capital gains because dividends are taxed as income, which typically have higher tax rates, while capital gains is treated separately and more advantageously. This can vary from country to country, but in the US, this is how taxes are done.
Another issue with this model is that it implicitly assumes that dividends are correlated to actual earnings. This isn’t necessarily true because of what I mentioned in the free article, which is that signaling theory imposes costs on companies such that they really want to avoid cutting their dividend. This means that when times are good and earnings are high, less of that may get allocated in anticipating of tight years, and in tight years, the company may even borrow to pay a dividend which is a pretty inefficient use of capital (from a tax perspective at the very least). Another, albeit smaller issue, is that the dividend discount model doesn’t account for controlling interest that some shareholders would obtain if they are large enough.
There is a premium associated with control of a company, such that these “strategic investors” would pay more for a company because ownership of that company provides some additional benefits. This premium is usually between 20-30%, although they have reached as high as 70% (and probably higher, but we wouldn’t know due to missing data). It’s worth noting these control premiums fluctuate pretty heavily from country to country. For example, in Q2 2018, the average control premiums for the US were around 63% while Europe saw an average of about 39%.
Now, a bigger issue with dividend discount models is share buybacks. Share buybacks are becoming a bigger phenomenon in the US because it’s a more flexible way of returning capital to shareholders.
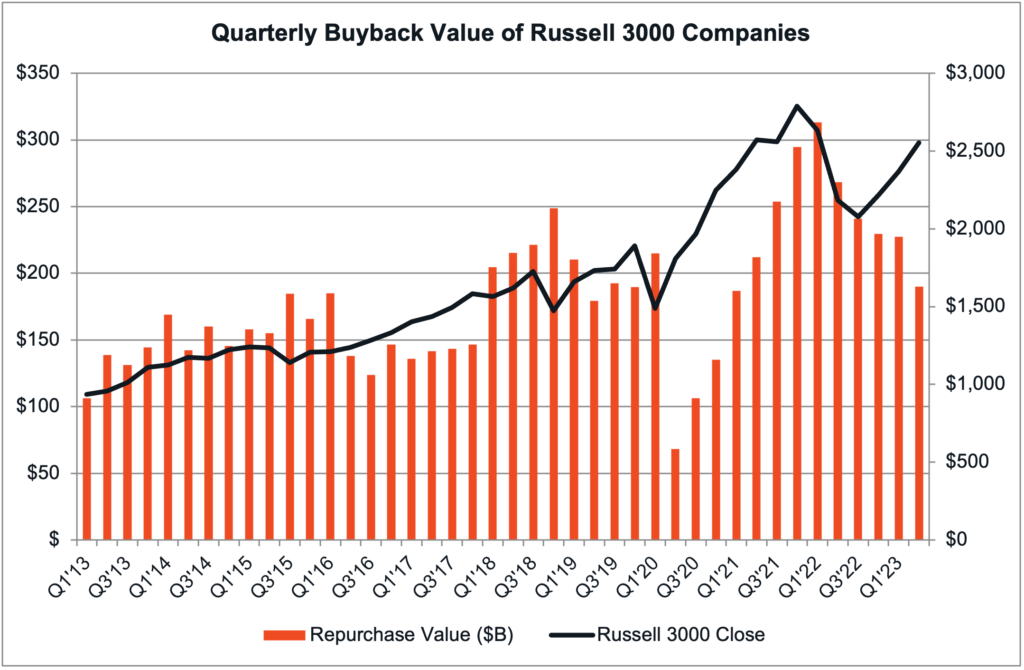
If a company has a pile of money they’d like to give back to investors, they can issue a dividend but some investors won’t be happy about that because it isn’t very tax efficient. If a company conducts a share buyback, the investor then gets to choose if they want to sell their shares and convert to cash.
At the end of the day, this model can be an extremely useful tool when it comes to confirming or denying an investment, but it should be used with caution. One advantage is that it facilitates comparability, but it should be used with the above in mind. Like all tools in a toolbelt, you have to know when and how to use it. Hopefully this has given you some insight into how to apply this tool.