
Egg Prices, Trade Wars, and the Wealth Divide: Understanding Inflation’s Hidden Drivers
From avian flu to tariffs and spending habits, this week’s deep dive explores the forces shaping the economy—and what they mean for your finances.

Key Takeaways
In the news: America’s $1.2 Trillion Trade Deficit – The U.S. trade deficit in goods hit a record $1.2 trillion in 2024, driven by deficits with Mexico ($172B), China ($295B), and Vietnam ($123B), as shifting supply chains and new tariffs reshape global trade.
Chart of the week: The Politics of Egg Prices – A severe avian flu outbreak has led to mass culling of egg-laying hens, driving up prices and highlighting how inflation is often driven by external factors beyond presidential policies.
Beyond bias: The Illusion of Control in Investing – Investors often overestimate their ability to predict market movements, leading to excessive trading and underperformance, as studies show that even professionals struggle to consistently beat the market.
Building wealth: The One-Year Rule to Prevent Lifestyle Inflation – Delaying major lifestyle upgrades for at least a year after an income increase prevents financial overcommitment and helps maintain long-term wealth accumulation.
Historical perspective: The Panic of 1893 and Overinvestment in Railroads – One of the worst financial crises in U.S. history was fueled by speculative railroad expansion, drawing parallels to modern asset bubbles in tech startups and real estate.
Literature review: AI vs. Human Economic Forecasters – A new study finds that AI-generated economic forecasts outperform human predictions in accuracy, particularly at longer time horizons, though they still rely on past data and human biases.
Have a question?
I’m adding something new this week—reader Q&A. If you have a question about the economy, investing, financial decision-making, or historical finance, submit it anonymously using the form below. Each week, I’ll pick one question and provide a detailed response in the next newsletter.
This isn’t financial advice, but I’ll break down ideas, provide deeper research, and share insights on topics you’re curious about. If you accidentally include personal details, I’ll remove them and keep the discussion hypothetical.
No question is too big or too small—if you’re wondering about something, chances are others are too. Submit your question here, and I’ll tackle it in the next edition!
In the news
America’s $1.2 Trillion Trade Deficit: Who’s Driving It?
The U.S. trade deficit in goods hit a record $1.2 trillion in 2024, a growing economic headache for policymakers. Mexico, China, and Vietnam were among the biggest contributors to the imbalance, though shifting supply chains have changed the dynamics of global trade.
China remains the largest trade deficit partner ($295B), but its gap has narrowed from a peak of $418B in 2018. Many companies have moved supply chains to other countries to avoid tariffs, which has expanded deficits with Vietnam ($123B) and India.
Mexico has surpassed China as America’s top supplier of goods, but the U.S. also runs a $172B trade deficit with its southern neighbor, mainly driven by car and electronics imports.
President Trump is doubling down on tariffs—25% tariffs on Canada and Mexico were announced but then paused after diplomatic negotiations. A new 10% tariff on Chinese imports has already sparked retaliation, with China imposing new tariffs on U.S. coal and liquefied natural gas (LNG).
The U.S. runs a trade surplus in services, aircraft, and mineral fuels, but its largest deficits are in machinery, electronics, vehicles, and pharmaceuticals.
Higher tariffs could raise costs for businesses and consumers while worsening trade tensions with major partners. Companies that moved production from China to Vietnam and Mexico may face new trade barriers if tariffs expand, impacting supply chains and pricing.
The U.S. Economy Now Depends More Than Ever on the Rich
A growing divide in spending habits has made the top 10% of earners (households making $250K+) the backbone of the U.S. economy.
High earners now account for nearly 50% of all consumer spending, up from 36% in 1989. Their spending increased 58% over the past four years, far outpacing inflation.
Meanwhile, the bottom 80% of earners saw their spending grow just 25%, barely keeping up with inflation. Many have depleted pandemic-era savings and are cutting back.
Wealthier consumers are driving demand in luxury travel, premium airline seats, and high-end goods, while middle- and lower-income households are pulling back on discretionary purchases.
A downturn in the stock market or real estate could have outsized effects—if high earners slow their spending, economic growth could stall.
The economy is increasingly reliant on the wealthy, making it more vulnerable to financial market fluctuations. If asset prices fall, spending could slow sharply. Meanwhile, the middle class is struggling, limiting broader economic resilience.
Federal Spending Is at Record Levels—And Interest Costs Are Soaring
The U.S. government’s budget has doubled since 2015, reaching nearly $6.8 trillion in 2024. While pandemic relief has wound down, long-term structural costs are rising.
Social Security and Medicare remain the largest budget items, growing as the population ages. These costs will continue to climb, putting pressure on future budgets.
The fastest-growing expense is interest on the national debt, which is surging due to both rising borrowing and higher interest rates. The cost of servicing debt now consumes a growing share of tax revenue.
Some Republicans are calling for spending cuts back to 2019 levels to offset tax cuts and rein in the deficit, but major reductions would likely face political resistance.
Defense spending is increasing, and Medicaid costs remain high due to expansions under the Affordable Care Act.
The U.S. faces a long-term debt challenge that could lead to higher taxes, spending cuts, or more borrowing. If interest costs keep rising, future budgets will be constrained, making it harder to fund new initiatives.
For businesses and consumers, this means navigating potentially higher costs, shifting economic conditions, and an unpredictable policy environment.
If you’re following these trends:
Watch for inflationary effects of tariffs—higher prices on imported goods could trickle down quickly.
If you’re in the middle-income bracket, budget cautiously. Rising debt and stagnant wage growth suggest financial pressure isn’t going away soon.
Long-term investors should keep an eye on government debt. If deficits continue to grow, higher interest rates could weigh on economic growth.
Chart of the week
Recent debates have scrutinized current President Donald Trump over escalating egg prices, a concern that underscores the complex nature of inflation and its multifaceted causes. The current surge in egg prices is primarily attributed to a severe avian influenza outbreak, which has led to the culling of millions of egg-laying hens, drastically reducing supply and driving prices upward. This situation exemplifies how external factors, such as disease outbreaks, can significantly influence inflation in specific sectors, often beyond the immediate control of political leaders.
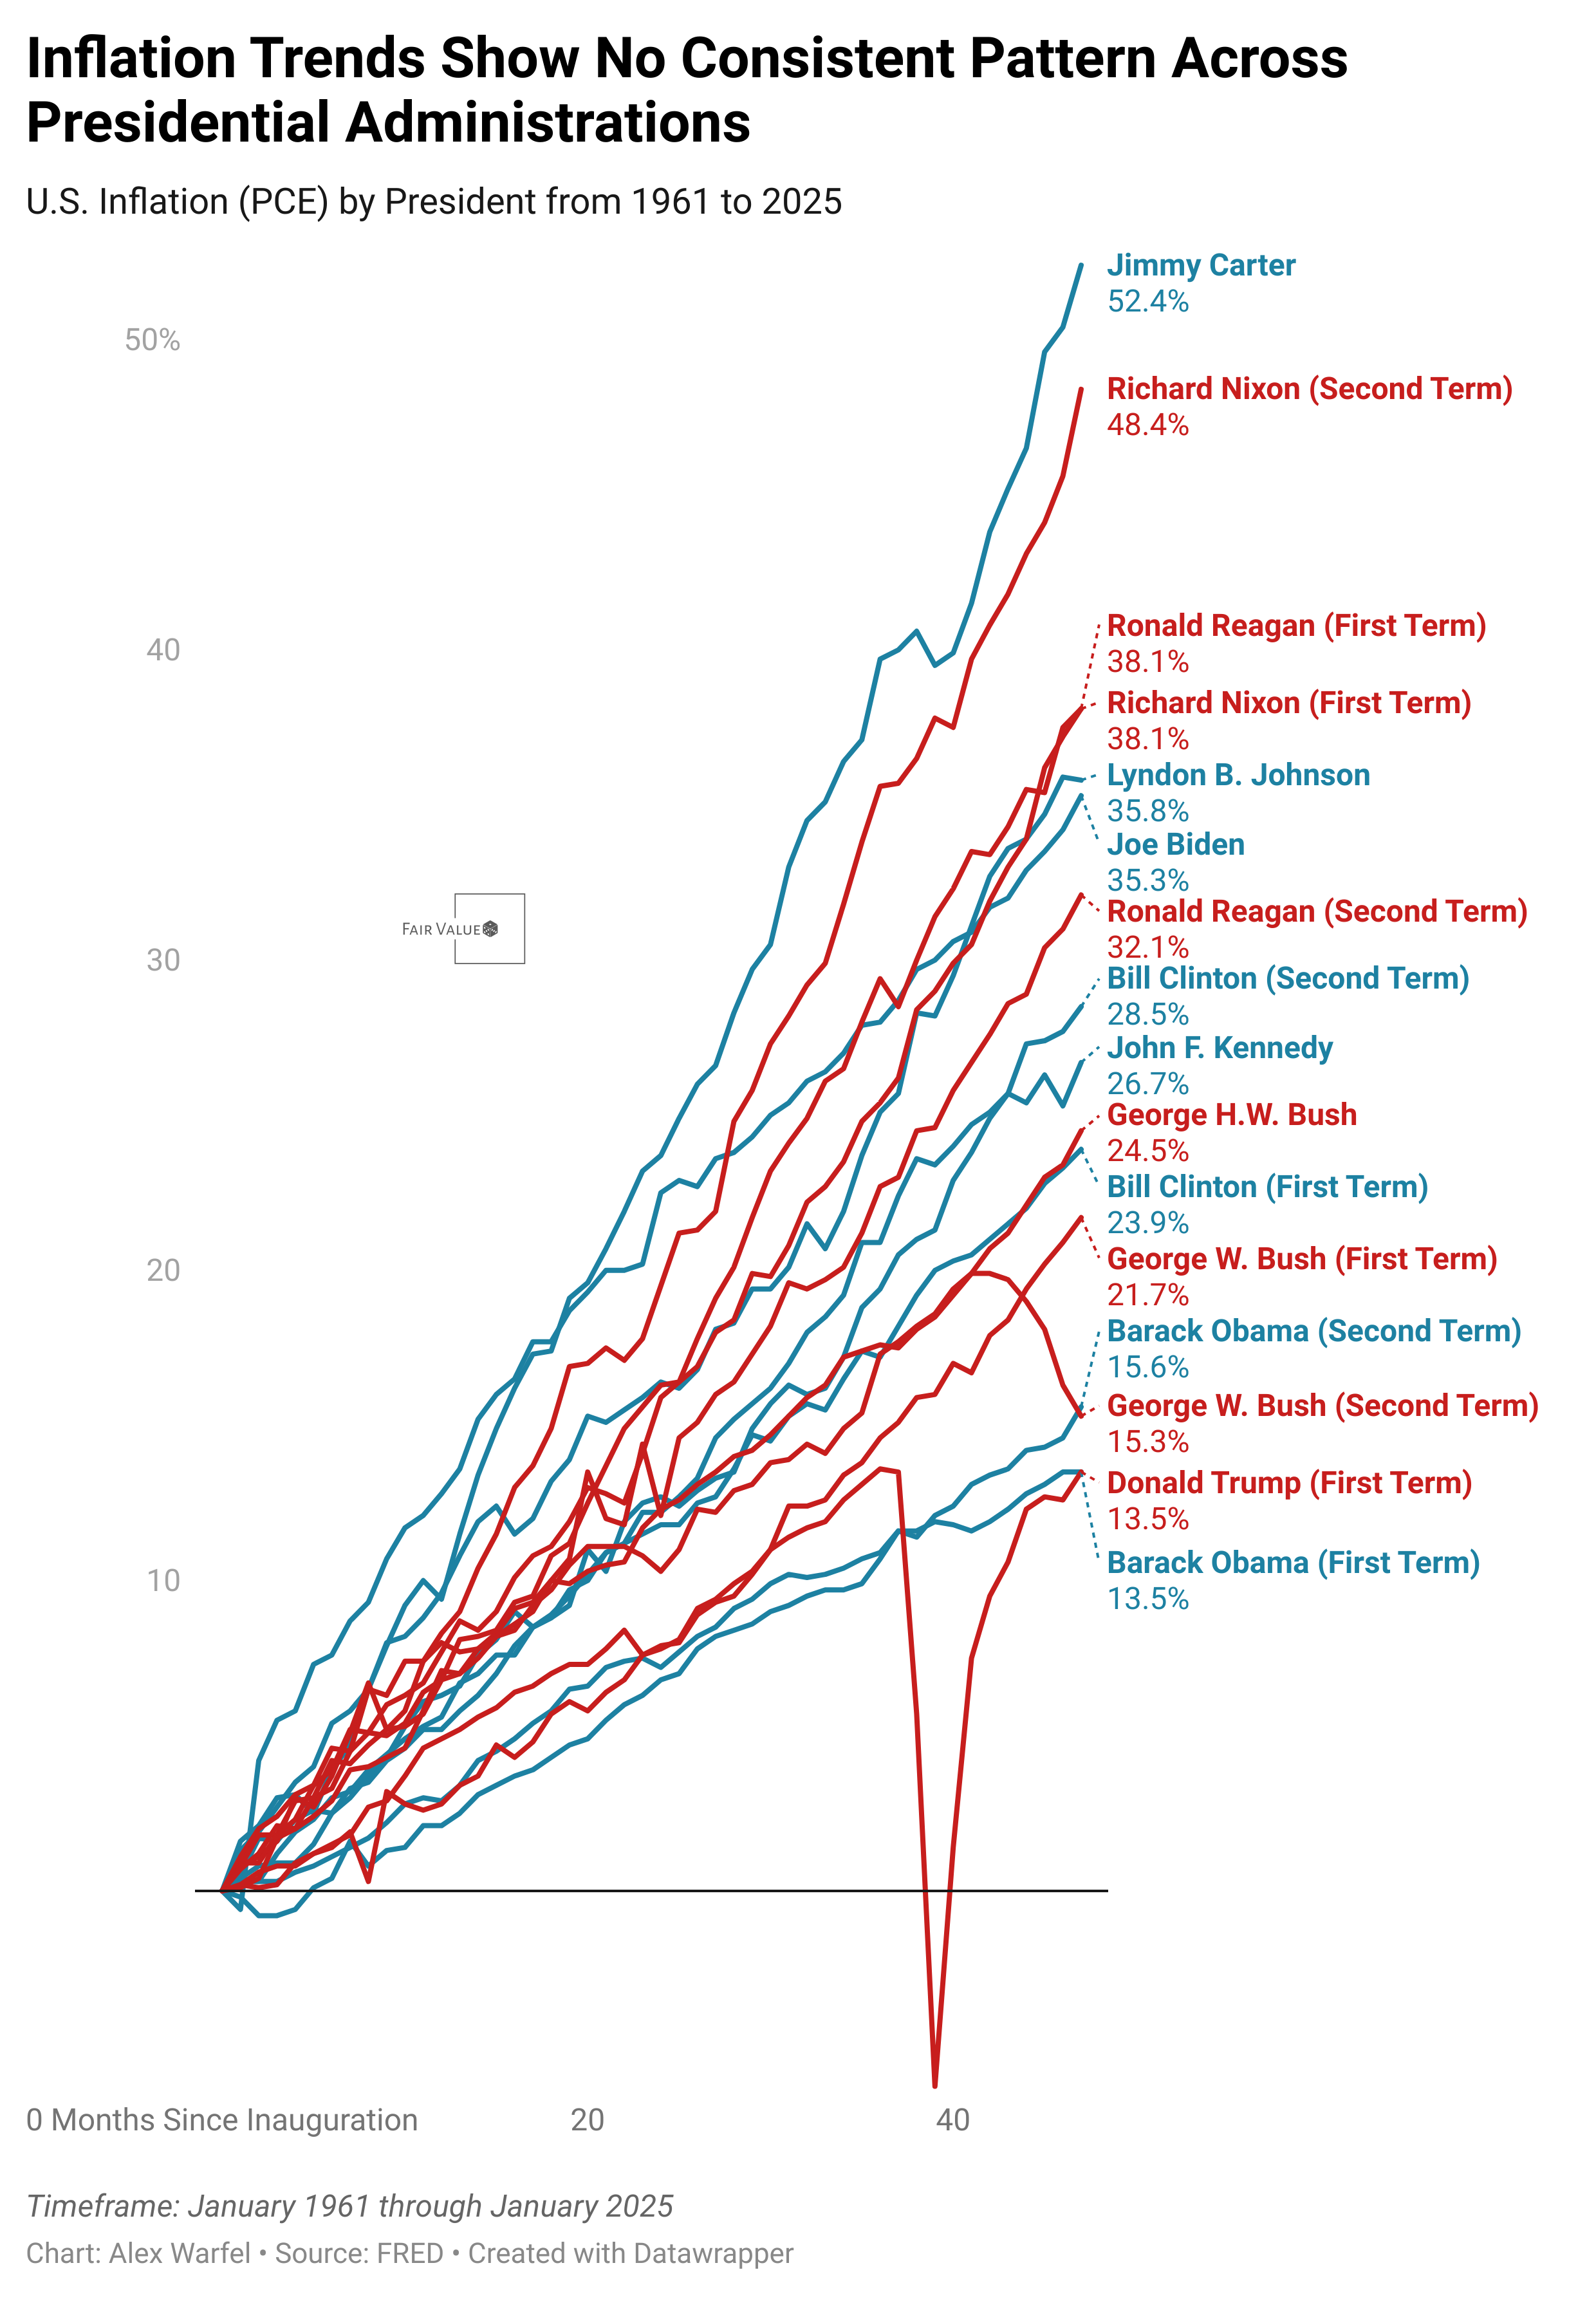
Historically, presidents have grappled with inflation driven by external events. During Jimmy Carter’s administration, the late 1970s oil crisis, precipitated by OPEC’s embargo, led to soaring energy prices, contributing to widespread inflation. Similarly, Barack Obama’s tenure saw subdued inflation rates as the economy struggled to recover from the 2008 financial crisis. More recently, President Joe Biden faced inflationary pressures largely due to supply chain disruptions and labor shortages resulting from the COVID-19 pandemic. These instances highlight that while presidential policies can influence economic conditions, inflation is often driven by complex, external factors beyond a president’s direct control.
Beyond bias
The illusion of control is a cognitive bias in which investors believe they can predict or influence market outcomes more than they actually can. This overconfidence often leads to excessive trading, risky speculation, and the misallocation of capital. Langer (1975) was one of the first to document this phenomenon, showing that people behave as if they have control over purely random events, particularly in financial decision-making. In investing, this manifests as traders believing that their research, intuition, or experience grants them an edge over the broader market, despite overwhelming evidence that market movements are largely unpredictable. Barber and Odean (2001) found that investors who trade more frequently—presumably due to their belief in personal skill—tend to underperform those who trade less, primarily because they incur higher transaction costs and fail to accurately time market movements. The illusion of control also contributes to active fund managers’ persistent underperformance relative to passive indices, as documented by Fama and French (2010), reinforcing the idea that even professionals are not immune to this bias.
Overcoming the illusion of control requires recognizing the inherent randomness of markets and adopting strategies that minimize the impact of emotional decision-making. Research suggests that investors who follow systematic, rules-based approaches tend to outperform those who trade based on intuition or overconfidence (Kahneman & Riepe, 1998). Diversification, periodic rebalancing, and passive investing through index funds help counteract the temptation to believe in one’s predictive abilities. Additionally, acknowledging the efficient market hypothesis (Fama, 1970) can help investors shift their focus from trying to outguess the market to optimizing risk-adjusted returns over time. Studies also show that simple heuristics, such as setting pre-determined asset allocation targets or employing dollar-cost averaging, help investors resist the urge to time the market based on perceived control (Benartzi & Thaler, 1995). By recognizing and mitigating the illusion of control, investors can avoid costly mistakes and improve their long-term financial outcomes.
Building wealth
Lifestyle inflation—the tendency to increase spending as income rises—is one of the biggest obstacles to long-term wealth accumulation. The “One-Year Rule” is a simple but highly effective strategy to prevent this by delaying any major lifestyle upgrades, such as buying a new car, moving into a bigger house, or significantly increasing discretionary spending, until you have maintained a higher income level for at least 12 months. This waiting period ensures that your new earnings are sustainable rather than temporary, preventing financial overcommitment based on an income level that might not last. Research in behavioral finance shows that people tend to anchor their spending to their current earnings, leading to a cycle of living paycheck to paycheck despite making more money (Shefrin & Thaler, 1988). By delaying major purchases, you allow yourself time to reassess whether your new financial situation is truly stable and whether an upgraded lifestyle aligns with your long-term financial goals.
To implement the One-Year Rule effectively, track your income and expenses consistently over time. If you receive a promotion, a bonus, or start earning more from a side business, set a clear waiting period before making any major spending decisions. This time buffer helps you determine whether the income boost is sustainable or temporary, reducing the risk of financial regret. Studies on hedonic adaptation—the psychological tendency to quickly become accustomed to new financial circumstances—suggest that delaying lifestyle upgrades can improve long-term happiness and financial security (Frederick & Loewenstein, 1999). Instead of immediately increasing consistent costs, redirect a portion of your new earnings toward investments, emergency savings, or debt repayment. Over time, this approach helps build a solid financial foundation while giving you the flexibility to enjoy lifestyle upgrades that truly enhance your quality of life, rather than ones driven by impulse or social pressure.
Add to your toolbelt
Take control of your financial future with Rainier FM—your AI-powered financial planning companion. FM stands for Financial Model, and that’s exactly what this app delivers: optimized, data-driven financial plans tailored to your goals. Using advanced optimization techniques and AI-driven insights, Rainier FM helps users navigate everything from retirement planning to wealth building with confidence. Pricing reflects the cost of running the service, but I’m actively gathering feedback to refine and improve it. Here’s an example of an insight this app can help you uncover.

If this sounds like something you’d find valuable, feel free to reach out or sign up—I’d love to hear what you think as I continue developing the platform!
Historical perspective: The Panic of 1893 and the Railroad Bubble
The Panic of 1893 was one of the most devastating economic crises in U.S. history, triggered by rampant overinvestment in railroads and speculative financial practices. Railroads were the dominant industry of the late 19th century, serving as both the backbone of commerce and the most attractive sector for investment. The expansion of rail networks promised to revolutionize transportation, commerce, and regional development, attracting massive amounts of capital from both domestic and foreign investors. However, by the early 1890s, rail companies had overextended themselves, accumulating unsustainable levels of debt to fund expansion projects that were often unprofitable. When a few key railroad companies, most notably the Philadelphia and Reading Railroad, collapsed in early 1893, panic spread throughout the financial sector, leading to bank failures, stock market declines, and an economic depression that lasted for years (Calomiris & Gorton, 1991).
The economic fallout was severe. With banks heavily invested in railroads, their failures triggered a credit crunch, drying up access to capital and exacerbating the crisis. Over 500 banks closed, businesses shuttered, and unemployment soared to nearly 20% in some areas (Romer, 1989). The U.S. government, still operating under the gold standard, faced a dwindling gold reserve, further undermining confidence in the economy. The crisis also had significant political consequences, leading to public distrust in financial institutions and eventually influencing the populist movement that sought monetary reform, including the push for free silver over gold-backed currency (Friedman & Schwartz, 1963). The collapse of speculative railroad investments provided a stark lesson in the dangers of financial excess, demonstrating that unchecked expansion in a single sector can destabilize the entire economy when growth proves unsustainable.
The parallels between the Panic of 1893 and modern economic crises are striking. Just as the railroads were seen as the high-growth industry of their time, the dot-com boom of the late 1990s and the housing bubble of the mid-2000s saw speculative excesses fueled by easy credit and investor optimism. In both cases, overleveraged companies collapsed when revenues failed to match expectations, triggering broader financial panics. The railroad bust also mirrors recent developments in the tech sector, where venture capital-funded startups frequently operate at a loss while relying on continuous investment to sustain operations. When capital markets tighten, as seen in 2022 with rising interest rates, the viability of these companies comes into question, much like the overbuilt and underused rail lines of the late 19th century (Kindleberger & Aliber, 2011).
The lessons from the Panic of 1893 remain relevant today. Overreliance on a single booming industry, coupled with excessive leverage and speculative investment, can lead to economic disaster when optimism turns to panic. The crisis underscored the importance of financial diversification, responsible lending, and regulatory oversight to prevent systemic collapse. It also demonstrated that economic recoveries are often slow and painful, particularly when tied to structural issues in banking and monetary policy. As investors and policymakers navigate new technological and economic frontiers, the cautionary tale of 1893 serves as a reminder that no industry, no matter how transformative, is immune to the risks of overexpansion and financial mismanagement.
Supporting Research:
Calomiris, Charles W., & Gorton, Gary. “The Origins of Banking Panics: Models, Facts, and Bank Regulation.” Financial Markets and Financial Crises, University of Chicago Press, 1991.
Romer, Christina D. “The Prewar Business Cycle Reconsidered: New Estimates of Gross National Product, 1869-1908.” Journal of Political Economy, vol. 97, no. 1, 1989, pp. 1–37.
Friedman, Milton, & Schwartz, Anna Jacobson. A Monetary History of the United States, 1867-1960. Princeton University Press, 1963.
Kindleberger, Charles P., & Aliber, Robert Z. Manias, Panics, and Crashes: A History of Financial Crises. Palgrave Macmillan, 2011.
Literature review
Simulating the Survey of Professional Forecasters
The study by Hansen et al. (2025) presents a novel approach to economic forecasting by simulating the Survey of Professional Forecasters (SPF) using large language models (LLMs). The authors construct synthetic forecaster personas based on hand-gathered individual-level data from SPF participants, integrating real-time macroeconomic data into an LLM-powered simulation. This methodology aims to evaluate whether AI-generated forecasts can replicate or surpass human forecasts in accuracy, particularly over different time horizons.
The researchers employ a structured multi-step methodology:
Forecaster Persona Construction: The authors leverage publicly available information on SPF participants, including education, institutional affiliation, and career history. These details are used to create AI-generated personas that mimic the decision-making of actual forecasters.
Data Inputs: The AI models receive real-time macroeconomic indicators, historical SPF median forecasts, and individual forecaster characteristics as inputs.
LLM Implementation: The study primarily utilizes GPT-4o mini, a model chosen after benchmarking various LLMs (GPT-3.5, GPT-4, GPT-4o) under different temperature settings to optimize consistency and accuracy.
Forecasting Process: AI forecasters generate predictions for key macroeconomic variables, including real GDP, CPI inflation, unemployment rate, and interest rates, for time horizons ranging from nowcasts to four quarters ahead.
Benchmarking Against Human Forecasts: The AI-generated forecasts are compared against historical SPF responses using distributional metrics, mean absolute errors (MAEs), and out-of-sample tests for 2024 data.
To control for look-ahead bias, the models are explicitly restricted from accessing future data. Moreover, robustness checks include alternative model architectures, prompt modifications, and removal of key input features (e.g., real-time data, past SPF forecasts) to assess their impact on forecast accuracy.
The findings reveal that LLM-generated forecasts exhibit remarkable accuracy, often outperforming human forecasts, particularly at medium- and long-term horizons. Key results include:
AI forecasts for real GDP and unemployment rate outperformed human forecasts in 63-81% of SPF surveys conducted between 1990 and 2023.
The mean absolute error (MAE) of AI forecasts was significantly lower than human forecasters for most macroeconomic indicators, especially in the four-quarter-ahead horizon.
AI-generated inflation forecasts exhibited greater responsiveness to business cycles, capturing economic trends more effectively than human projections.
Inclusion of forecaster characteristics and past SPF forecasts significantly improved AI forecast accuracy. Removing past SPF data led to a 53-757% increase in MAE, demonstrating its crucial role as a proxy for latent human insights.
AI models struggle with recalling historical data, suggesting that their advantage comes from pattern recognition rather than memory retrieval.
The study’s findings suggest that LLMs can serve as a powerful complement to human forecasting. The AI-generated forecasts benefit from systematic pattern extraction while avoiding cognitive biases and noise that often distort human predictions. This aligns with economic theories of expectation formation, where forecasters blend observable data (e.g., employment figures, inflation trends) with unobservable heuristics (e.g., intuition, sentiment). AI models, while lacking direct access to such unobservable factors, effectively approximate them using structured inputs.
A key takeaway is that AI forecasters do not replace human expertise but augment it. Policymakers and economists can leverage AI-driven simulations to:
Enhance forecast frequency beyond traditional quarterly surveys.
Reduce survey costs while maintaining accuracy.
Experiment with different forecasting conditions (e.g., varying levels of information availability).
Identify systematic biases in human forecasts by comparing them to AI benchmarks.
While the study presents compelling results, several methodological concerns merit attention:
Selection Bias in Forecaster Personas: The process of hand-collecting individual characteristics from publicly available sources may introduce selection biases, as not all forecasters disclose the same level of detail.
LLM Hallucination Risks: Despite explicit restrictions on look-ahead bias, LLMs do not inherently process time in a structured manner. The study employs strong recall tests to mitigate concerns, but further verification—perhaps through a controlled blind-test approach—could enhance robustness.
Lack of Structural Economic Modeling: AI-generated forecasts rely on pattern recognition rather than economic models such as dynamic stochastic general equilibrium (DSGE) models or vector autoregressions (VARs). While the AI method demonstrates empirical success, its theoretical grounding in macroeconomics remains unclear.
Dependence on Past SPF Forecasts: The study shows that AI forecasts deteriorate significantly without access to past SPF responses, implying that LLMs may rely heavily on historical human biases rather than offering purely independent forecasts.
Limited Out-of-Sample Testing: The 2024 Q1-Q4 out-of-sample test results are mixed, with AI outperforming human forecasts only in some cases. This suggests that AI’s advantages may diminish under real-world uncertainty, requiring further evaluation over longer periods.
This study provides strong evidence that LLMs can replicate and, in many cases, improve upon human economic forecasting. By integrating forecaster-specific traits, past forecasts, and real-time data, AI models effectively extract latent economic signals while minimizing biases. However, the approach’s dependence on past SPF data, potential hallucinations, and lack of structural economic reasoning highlight areas for further refinement. Future research could explore hybrid human-AI forecasting models, incorporating domain expertise and dynamic economic frameworks to create even more robust predictive systems.