
Apple and Microsoft: The Dynamic Duo Among the Magnificent Seven
What does the Lindy Effect, valuation multiples, investor expectations, and correlation have to say about Apple and Microsoft?

Hello! It’s been a while. I’ve been pretty busy with a few projects and I figured quality is better than quantity, so here’s a big, late article. Hopefully I don’t go this long again without writing!
Key points:
The magnificent seven probably doesn’t create as much risk as many have claimed.
Apple and Microsoft are interesting businesses that have lasted longer than average.
Both of these businesses yield higher valuation multiples than their peers, and for good reason.
More than 85% of their current stock price is based “expectations”.
To reach me with questions, please email alexwarfel@gmail.com. You can also reply to this email directly.
I’m going to get this out of the way first. It’s Magnificent Seven, not Magnificent 7. Numbers less than 10 should be written out. Morningstar, the multibillion dollar financial research firm, didn’t get the memo.

Dang, that’s a lot of accumulated value built up in those stocks! People are concerned about the stock market because of all of that accumulated value. On the other side of all of that reward must be risk, right? Well it would follow that if most of the gains in the S&P 500 came from just seven stocks, then those gains could be erased by those seven stocks as well. “Concentration” is a dirty word to a risk manager. However, if we look at how those stocks move in relation to each other, that may help to calm our fears. Take a look at this analysis from Piper Sandler, a premier investment bank.
Benson Durham, Piper Sandler’s head of global policy and asset allocation, argues that that concern is misplaced. His research found that the Magnificent Seven generally don’t move in tandem, and that volatility in returns on the S&P 500 is a bit lower including the big tech firms than it would be without them. The same is likely to be true in 2024, he said in a Tuesday research note that makes the case that investors don’t face bigger swings in the index regardless of the seven companies’ outsize role in it.
To be specific, Durham wrote that based on a statistical model known as GARCH, for generalized autoregressive conditional heteroskedasticity, volatility in returns for the S&P 500 stands at 10.9% excluding the Magnificent Seven. Including the tech titans yields a result of 10.5%. The same model suggests a difference of 0.4 percentage points in 2024, he found.
That might not seem logical, but as Durham notes, the math bears it out. Each of the seven might have higher volatility than the index as a whole, but the correlations among the stocks are relatively modest. They don’t move in lockstep in a way that would make the index so statistically concentrated as to increase risk.
Frankly, the sentence “That might not seem logical, but as Durham notes, the math bears it out.” isn’t very reassuring. We have trusted the math before. In fact, I’ve just been writing about recent financial crises. Whether it’s expected growth rates of VC backed companies or expected repayment rates of low credit score mortgages, the math often tells us whatever story we want to tell ourselves, or others. I think the jury is still out.
Anyway, of the Magnificent Seven, two caught more of my attention than the others. This chart from VisualCapitalist illustrates why.

What strikes me about this is that for twenty years these companies have been competing with each other, working to dominate the technology market in various ways. This got me thinking about the value that’s accrued to these companies since their inception, so I went and pulled the log-adjusted close price history to help understand these behemoths.

The above accounts for dividend reinvestment, which Apple has paid since 1987, with a pause from 1995 until 2012, likely reflective of their difficult stock performance. It’s interesting to see that these companies have grown so much and in different periods, but what shocks me is how long they’ve been around for. Most companies don’t last nearly as long.
A recent study by McKinsey found that the average life-span of companies listed in Standard & Poor’s 500 was 61 years in 1958. Today, it is less than 18 years. McKinsey believes that, in 2027, 75% of the companies currently quoted on the S&P 500 will have disappeared.
Source, December 2016
That was an older source, but it was the most recent study of its kind I could find. Consider the Lindy effect. If you aren’t familiar, here’s a great description:
The Lindy Effect was named after a New York deli and originally referenced the career prospects of comedians. The definition was since broadened so that today The Lindy Effect states that the future life expectancy of a non-perishable item is proportional to its current age. It reflects the common adage that things that have stood the ‘test of time’ are things that you can rely on.
Nassim Taleb, the author of Antifragile, captured this model well:
"If a book has been in print for forty years, I can expect it to be in print for another forty years. But, and that is the main difference, if it survives another decade, then it will be expected to be in print another fifty years.
"This, simply, as a rule, tells you why things that have been around for a long time are not “ageing” like persons, but “ageing” in reverse. Every year that passes without extinction doubles the additional life expectancy. This is an indicator of some robustness. The robustness of an item is proportional to its life!"
Whether you're exploring bitcoin versus gold, or electric versus gasoline engines, applying the Lindy Effect will encourage you to 'wait and see', because with each year a 'newcomer' survives it implies a proportionate increase in its longevity. In other words, new initiatives become less fragile with every year they persist.
Okay great, so most companies in the S&P 500 don’t have staying power, and Apple and Microsoft might be around for another 40-50 years. Talk about winner-take-all. Imagine Apple going the way of Sears though, it will happen one day. Well, let’s dig into what investors expect from these two companies. Here are some high level financial metrics to consider.

What can we glean from this? First, Apple’s price to sales multiple is more attractive than Microsoft’s. You would only need to own Apple stock for 28.3 years to see those earnings accrue to you, compared to Microsoft’s 36.5 years. Don’t worry about dividends, if you assume Apple and Microsoft are good at using those earnings for projects to make money, you’ll see the value of those earnings accrue in the stock price instead.
Overall though, that’s a long time to wait. Look at the price to sales. The overall S&P 500 price to sales ratio is about 2.7x, while AAPL and MSFT’s technology peers are at 5.7x, so compared to that, both of these companies are trading above their peer group’s valuations. If we shift our attention to margin at the bottom though, we can see why. These businesses are just powerhouses, which is likely driving the increased P/E ratio.
I want to make two points here.
First, I want to address the comparison of financial metrics in a vacuum. We can’t just look at valuation multiples and say something is overvalued, instead we need to take in the full breadth of the business to understand if valuation multiples are out of line. In fact, we should have something in our head to the tune of:
y = 24.05 * salespast5y + 74.63 * grossmargin + ...Most of you may recognize this as a linear regression formula. I think that’s an apt tool for thinking about valuations here. Investors are really thinking “What should I be paying for ‘that amount of earnings’ AND ‘that gross margin’?” relative to each other. Some businesses demand high multiples because of their incredible cash producing capabilities in conjunction with other characteristics.
Second, I think a particularly valuable valuation (hah) concept for tech companies is the idea of PVGO. PVGO stands for “present value of growth opportunities” and it essentially separates the valuation of a business into two pieces. The first piece is “How much of the valuation is because of the business’s CURRENT financial performance”. The second partition tells us about what investors EXPECT from the opportunities of the business in the future. The way to calculate this is:
PVGO = Value of stock - (earnings / cost of equity)Where
Cost of equity = Risk free rate of return + Beta * (Expected market return - risk free rate of return)For the purposes of this comparison, we’re going to say that Apple and Microsoft belong to the S&P 500 IT sector which has had a 10 year annualized return of 19.75%. We’re also going to say the risk free rate is 5.24% because that is the rate on the 3 month treasury bill when I checked it (a few days old by now). That’s a good benchmark because the risk free rate is supposed to be the absolute safest place to store money for short periods of time. Beta is calculated as the volatility of a security against a benchmark, stocks that return exactly what their benchmark did have a beta of 1. If they return more, their beta is 1+. Now, Apple’s beta is 1.31 (I recognize that this benchmark is likely different than the S&P 500 IT, but we’re just doing this for the sake of comparison). Microsoft’s is 0.9. Both of these numbers come from Yahoo. Here is the table with the formulas above applied. Equity risk premium is the finance word for the expected market return minus the risk free rate.
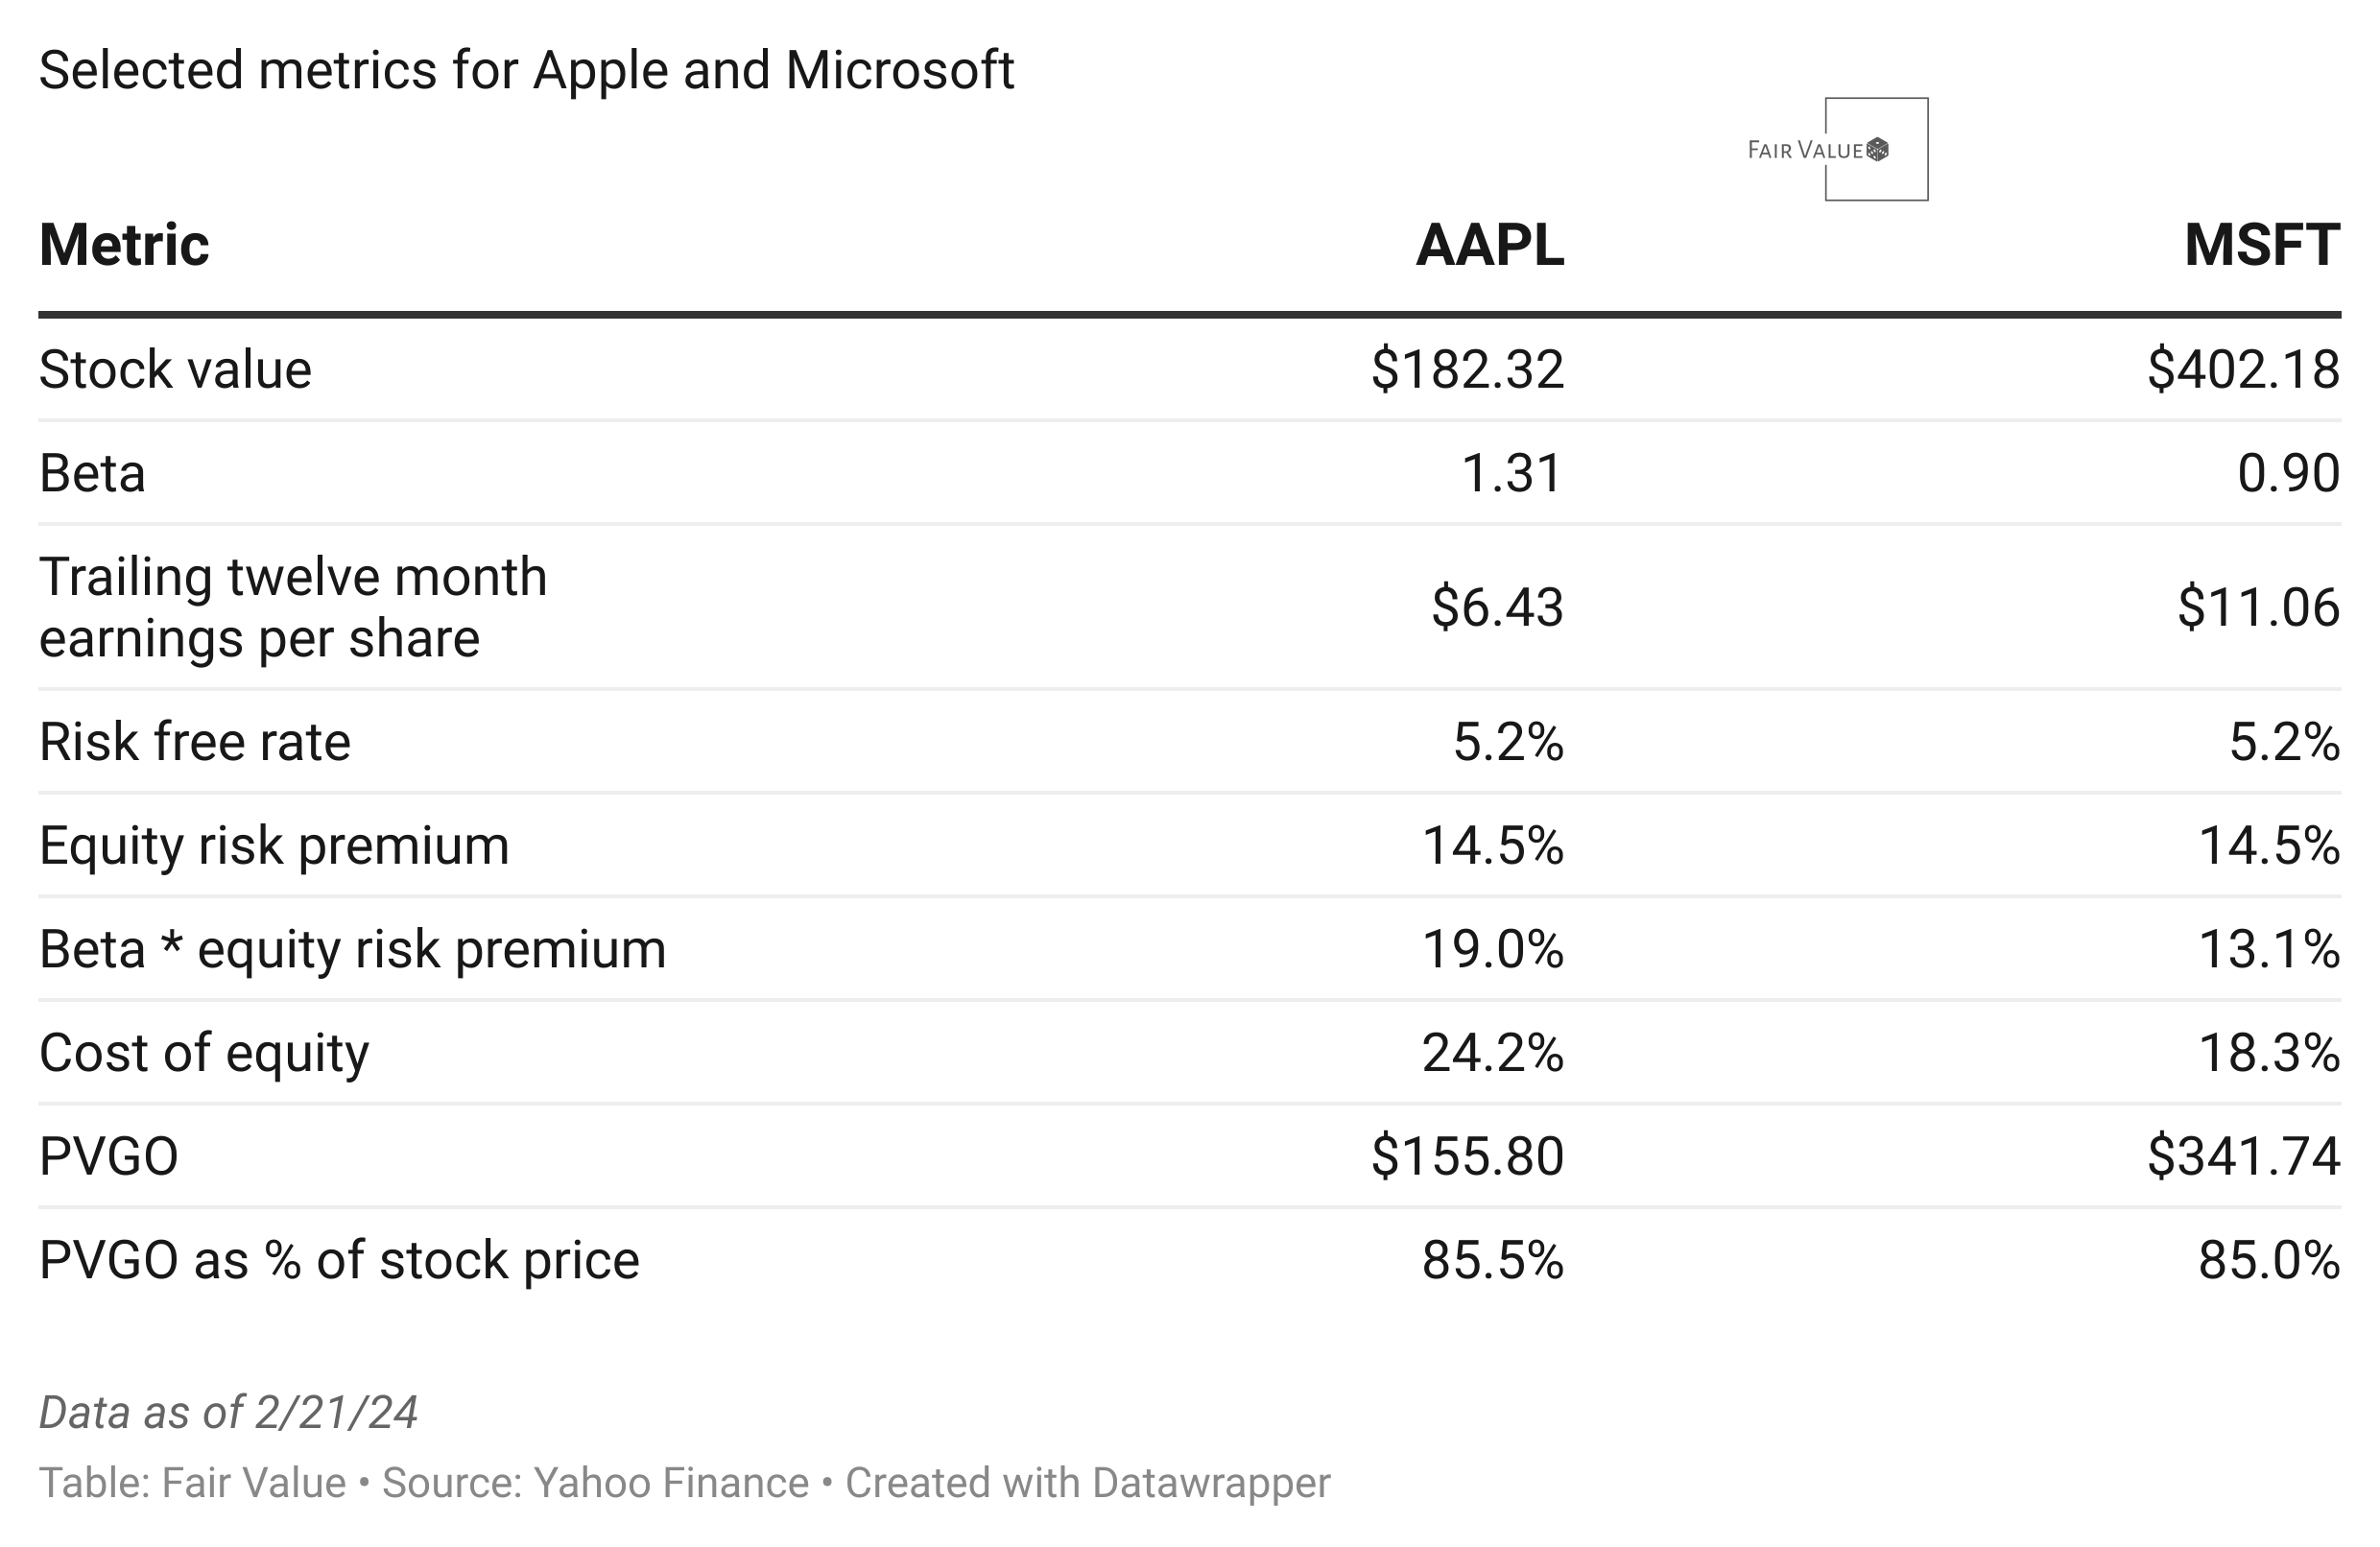
I’ll fast forward to the point. For both stocks, more than 85% of the value is tied up in investor expectations for future growth opportunities. Yikes. Another way of saying that is to say that only 15% of the current stock price is supported by earnings, the rest is expectations. Boy, imagine if some of those expectations don’t pan out.