
16 - Discounted cash flow models
The bread and butter of the financial analyst

This article is going to pick up on last week’s stock valuation method. You’ll want to look at the last article for some of the formulas that I’m using.
As a reminder, I’m trying something new. I will be publishing a paid version of this article that releases right after this one. The article you’re reading now is designed for anyone interested in improving their personal finances, but the paid version is “professional”, designed for people who may want a bit more of the details on a topic like this. I have chosen the cheapest price possible for these paid versions, Substack literally won’t let me charge a lower price. I am thankful for your time and attention, last week’s pro articles was free, and the one right after this will be too.
Key points:
A free cash flow model is calculated the same way a dividend discount model is, but instead of dividends the model considers free cash flow.
Terminal value tends to dominate the result of the model, meaning that the results are highly sensitive to these assumptions.
To request a topic anonymously, fill out this form. To reach me with questions, please email alexwarfel@gmail.com. You can also reply to this email directly.
Discounted cash flow models are, in some sense, an extension of the dividend discount model which we just discussed last week. This new model is handy because they don’t require a company to issue a dividend, but like the last model, it does hinge on knowing the end-period stock price, also known as “terminal value”. This is, of course, impossible to know. It's more flexible with assumptions and hones in on a business's value based on its anticipated future cash flows. The quick and dirty version is that instead of dividends, we’re going to be discounting free cash flow. You can actually go back and just use that exact same formula from the last article but replace the dividends as cash flows. But first, what is free cash flow?
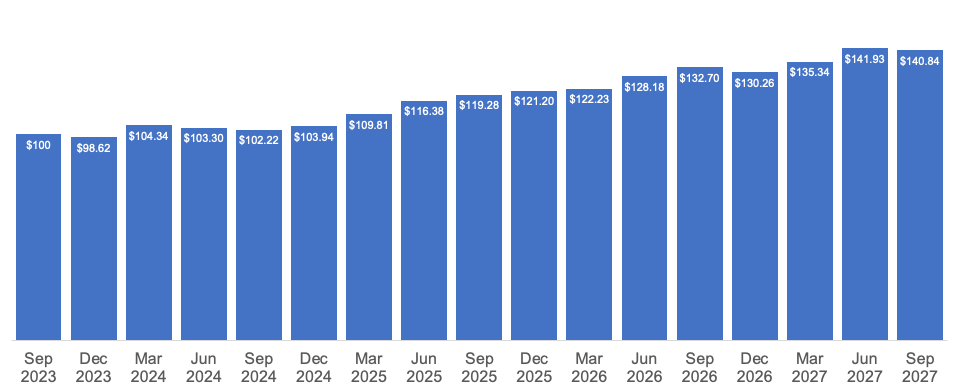
It's the amount by which a business's operating cash flow exceeds its working capital needs and expenditures on fixed assets (known as capital expenditures). This excess cash generation can be used to pay down debt, reinvest in the business, or pay out dividends. It can also just be saved for future use. This is essentially what the business returns to all stakeholders, shareholders, and bondholders alike. Let’s see what this looks like in practice. Consider a company where the free cash flow fluctuates each quarter. It would look something like this.
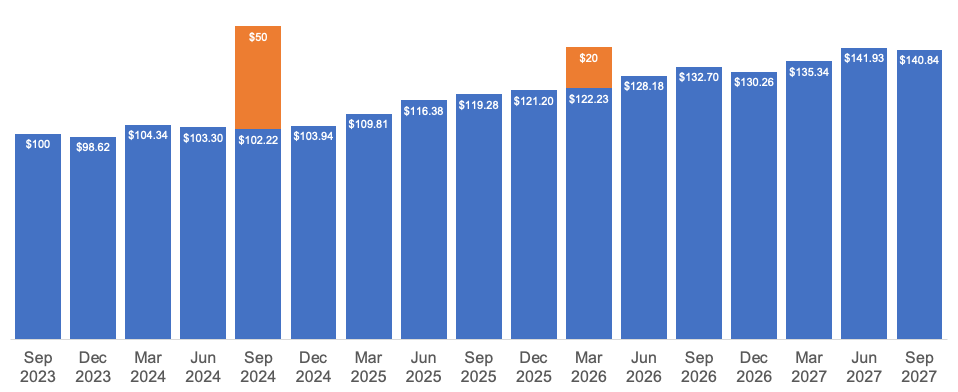
One major advantage of of this model is its flexibility. Let’s add in expected asset sales. These orange bars represent additional cashflows the company could receive after selling assets, therefore making this model flexible to other cash flows.
Now that we have a sense of what we expect the future cash flows to be, we need to discount them to account for the fact they’re in the future. There is often a lot of debate about what discount rate to use, so to keep things simple we’ll just use the 10 year treasury rate of 4.59% at the time of this writing. Analysts typically start here because the 10 year treausry represents what the market thinks a risk free investment should yield each year over the next 10 years. That’s because the US government is widely viewed as the most creditworthy borrower in the world. This is, of course, debatable.
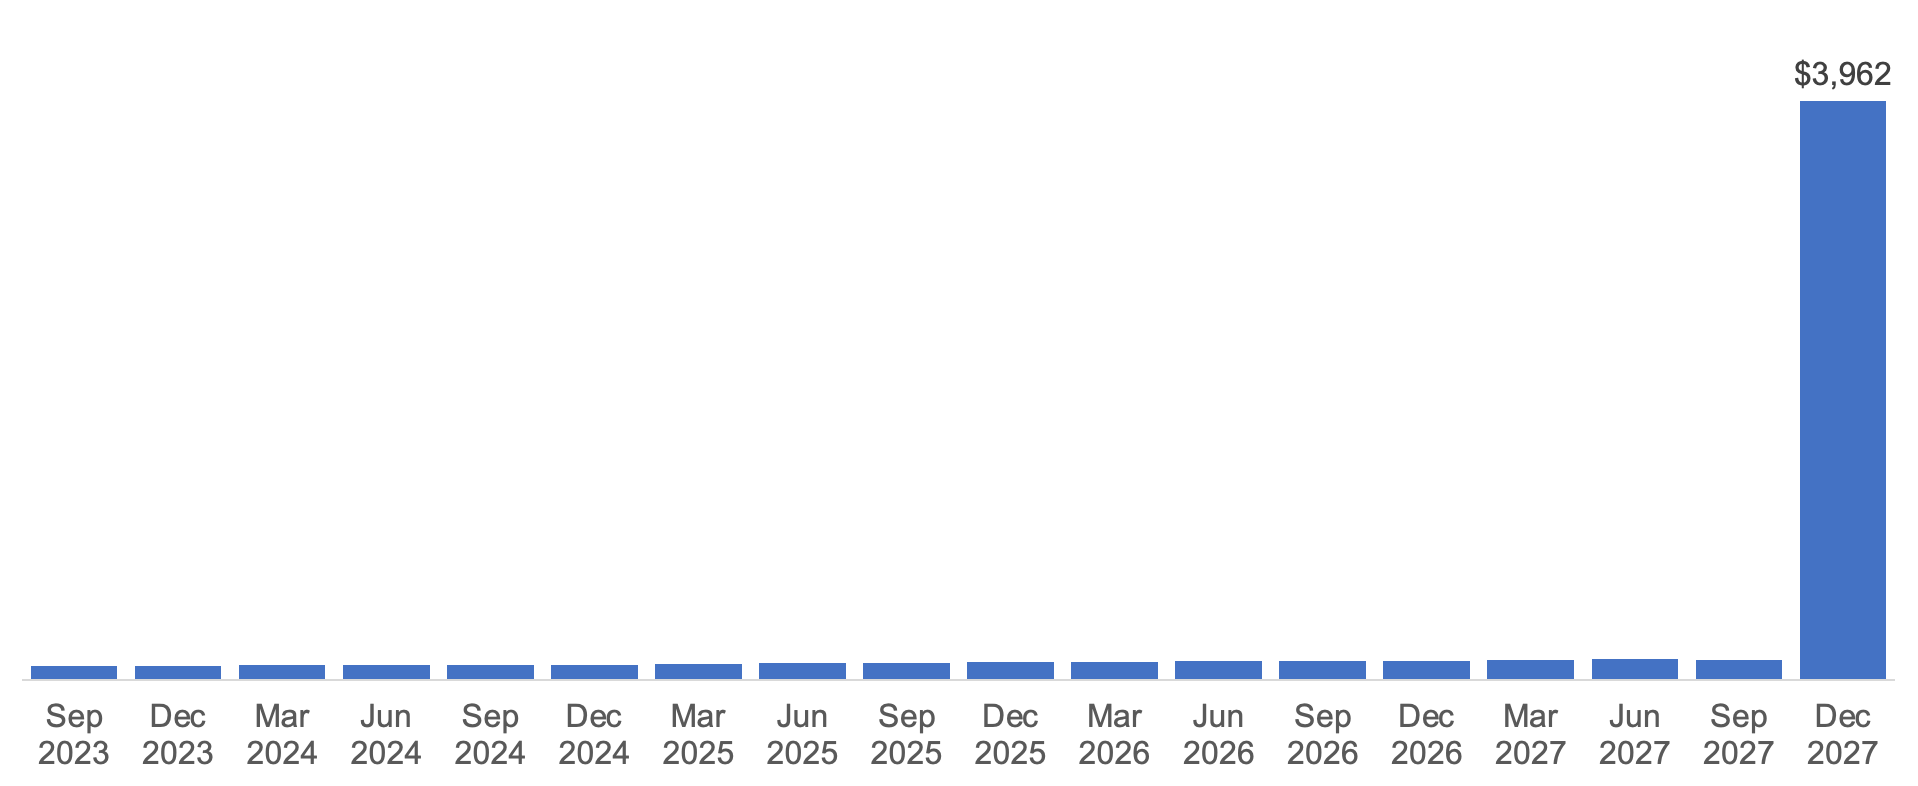
For this model, the last thing we need to do is to calculate something called the “terminal value”. This is supposed to be what the stock is worth at the end of our forcast period. This is calculated by the following formula. It’s pretty similar to the terminal value of the dividend discount model.

The intuition is that we’re going to assume the free cash flow grows as some rate in perpetuity and that stream of cash flows needs to be discounted. This cash flow goes at the very end of our cashflows, and it’s the last one we’ll forecast. It’s usually a very large cash flow which dominates the others. It looks something like this:
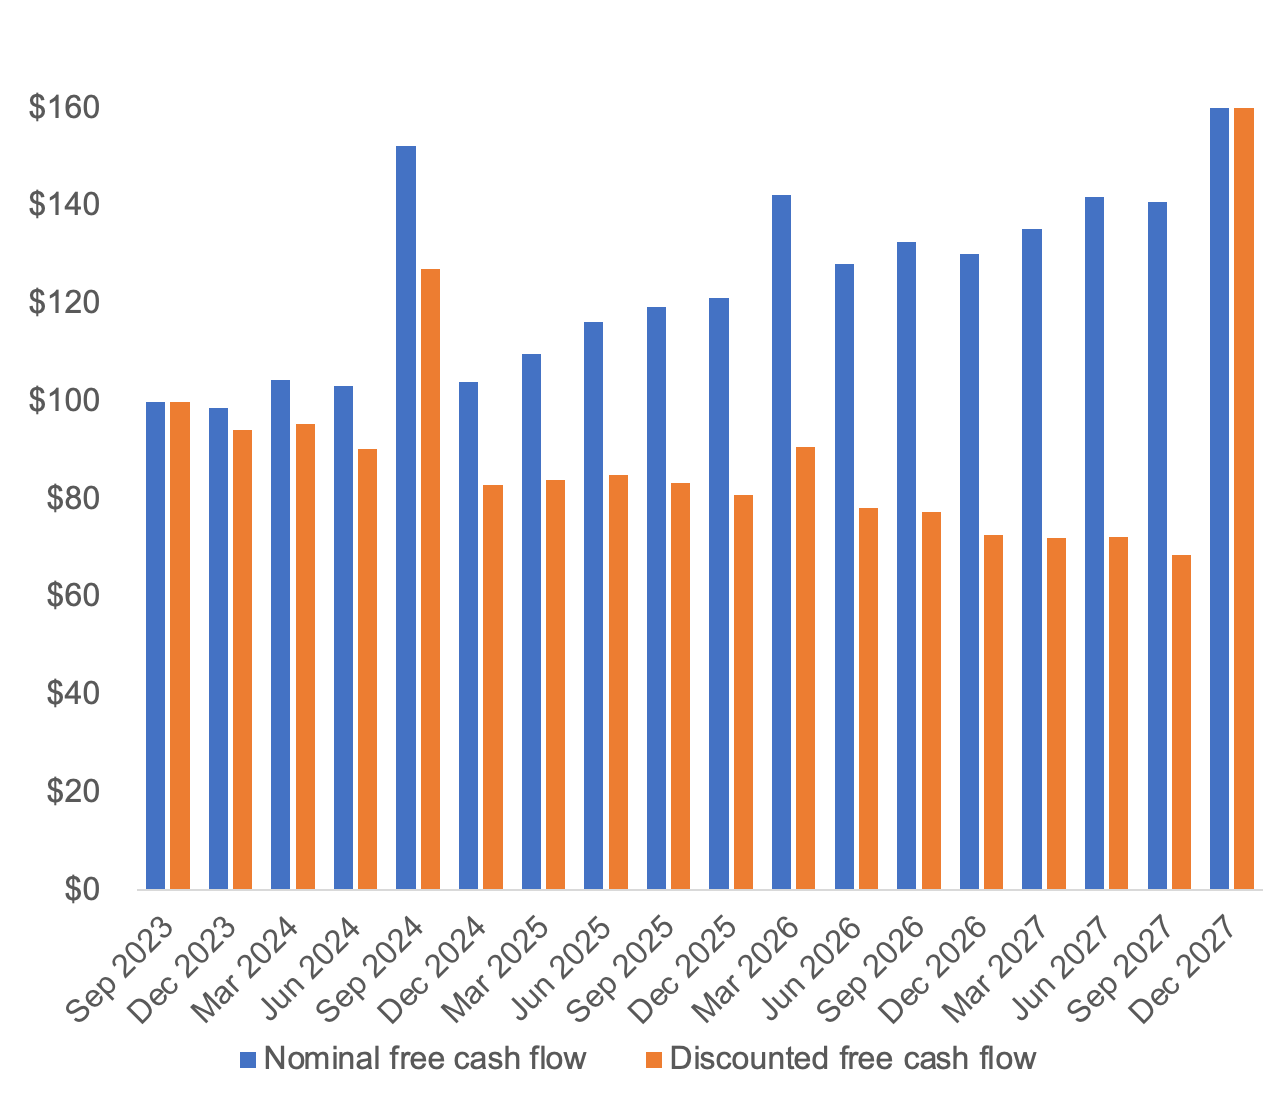
One of the big critiques of this model is that the terminal value dominates so much of the other cash flows. In our model this terminal value makes up more than 55% of all of the value of the stock. This should be concerning because financial markets are a chaotic system, which, in a technical sense, means that error compounds exponentially. The shorthand is that as time goes on, the model gets exponentially worse, so for 55% of the value of the model to be sitting as far out in the future as possible is concerning. Here’s what that looks like in graph form with discounting. Nominal just means that those are the cashflows before discounting.
When you sum up the above values, that gets you to what those cash flows are worth. Now, every investor has their own perspective on how large those nominal cash flows will be and what the discount rate is. When someone says a stock is worth more than it’s currently trading at, what they mean is that the nominal cash flows are higher or the discount rate is lower, or some combination of these two.
Support
If you’ve enjoyed this article and you’d like to support me, please consider checking out some of the spreadsheets that I’ve built to make your financial planning easy. Thank you!